The short leading indicators and the 2020 Presidential election forecast As I pointed out on Sunday, polls and poll aggregations really aren’t forecasts, they are nowcasts. They tell you who would win and by how much *if the election were held today.* They don’t tell you whether or by how much that is likely to change over the next few months. Further, candidates, campaigns, and voters react to them, and so change the dynamics. And in the case of several of them, most notably Nate Silver’s aggregations, since they only give you *probabilities* of each candidate winning, in a fundamental sense they are non-falsifiable — e.g., “well I *told* you that Candidate X had a 6% chance of winning, my model was correct!” Models based on economic fundamentals,
Topics:
NewDealdemocrat considers the following as important: politics, US/Global Economics
This could be interesting, too:
Robert Skidelsky writes Lord Skidelsky to ask His Majesty’s Government what is their policy with regard to the Ukraine war following the new policy of the government of the United States of America.
Joel Eissenberg writes No Invading Allies Act
Ken Melvin writes A Developed Taste
Bill Haskell writes The North American Automobile Industry Waits for Trump and the Gov. to Act
The short leading indicators and the 2020 Presidential election forecast
As I pointed out on Sunday, polls and poll aggregations really aren’t forecasts, they are nowcasts. They tell you who would win and by how much *if the election were held today.* They don’t tell you whether or by how much that is likely to change over the next few months. Further, candidates, campaigns, and voters react to them, and so change the dynamics. And in the case of several of them, most notably Nate Silver’s aggregations, since they only give you *probabilities* of each candidate winning, in a fundamental sense they are non-falsifiable — e.g., “well I *told* you that Candidate X had a 6% chance of winning, my model was correct!”
Models based on economic fundamentals, however, *can* forecast, because in the case of leading indicators, what the data is likely to show on Election Day is “baked in the cake” months before. For example, the model based on Q1 polling plus the Index of Leading Indicators are the end of Q1 already forecasts a Biden victory, by a substantial margin. That’s because the Index is supposed to tell you what the economy might be like 6 to 8 months later.
Short leading indicators are those which forecast where the economy is likely to be over the next 3 to 8 months, rather than a year, later. Several decades ago, Prof. Geoffrey Moore identified 11 of them:
Average workweek in manufacturing
Layoff rate under 5 weeks
Initial claims for unemployment insurance
ISM manufacturing vendor performance
ISM manufacturing inventory change
Journal of Commerce change in commodity prices
Change in deflated nonfinancial debt
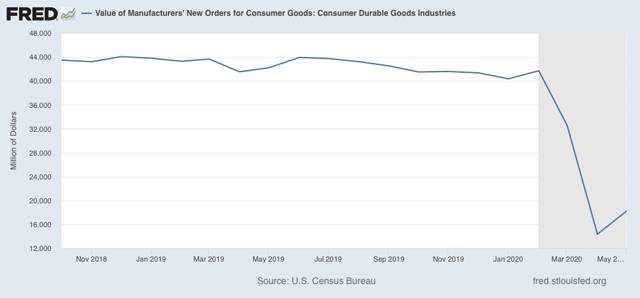
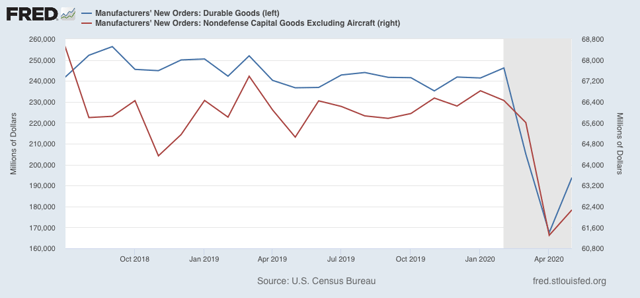
New orders for consumer goods and materials
Dun and Bradstreet change in the business populationContracts and orders for plant and equipmentWith the exception of the Dun and Bradstreet data (which I don’t think even exists anymore), the other 10 are still around, and the results through June are in for all but the two “new orders” categories. So taking a look at them ought to give us a good look at what the economy is likely to look like just before Election Day. To cut to the chase, they have all improved some of them almost back to pre-coronavirus levels, since April, but in general they are still worse than they were at the beginning of this year. So here they are in order.
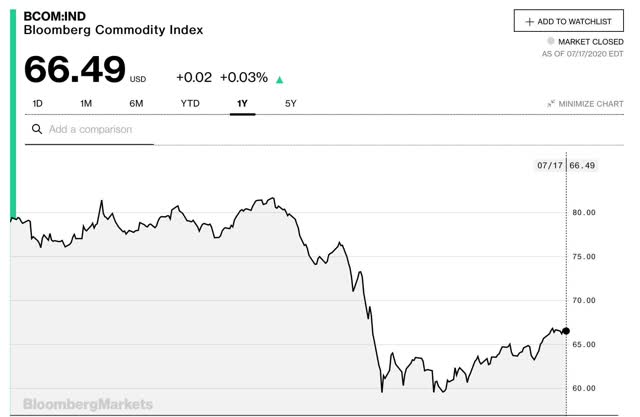
S&P 500 stock price index:
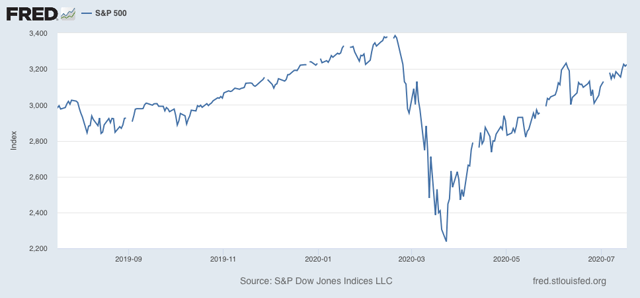
These have not made a new high since February, but have recovered over 3/4 from the March lows.
Average workweek in manufacturing:
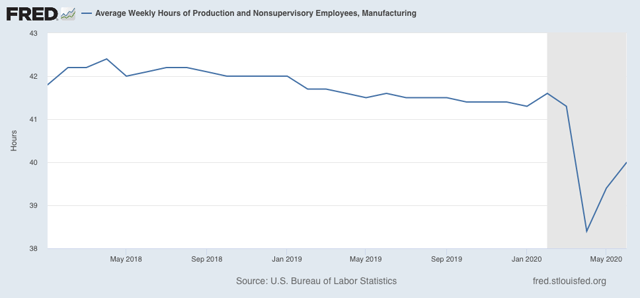
These have improved since April, but are still less than half the way back to pre-coronavirus levels.
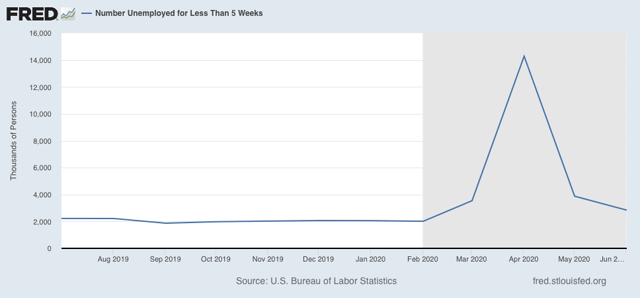
Layoff rate under 5 weeks
Initial claims for unemployment insurance
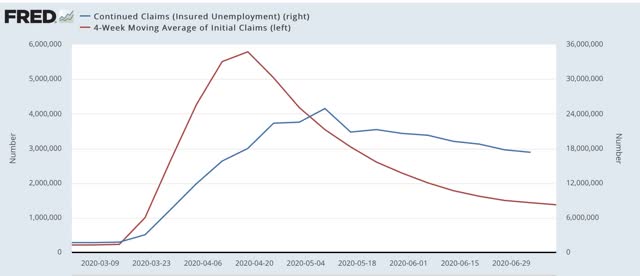
The former has improved by about 3/4’s from its worst levels. The latter has improved by about 90%. But both are still at levels comparable to their worst during the Great Recession.
ISM manufacturing new orders
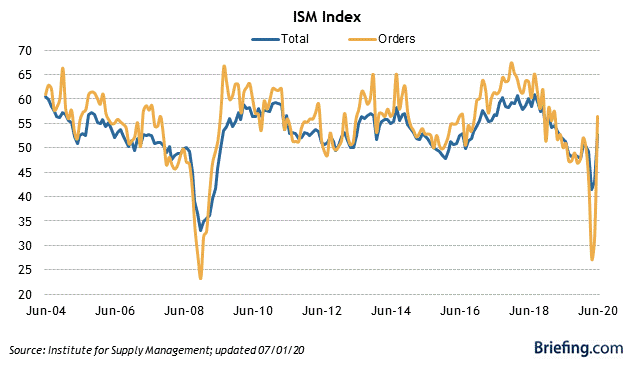
New orders have returned to expansionary levels.