Initial jobless claims improve slightly; continuing claims resume decline Weekly initial and continuing jobless claims give us the most up-to-date snapshot of the continuing economic impacts of the coronavirus on employment. More than three full months after the initial shock, the overall damage remains huge, with large spreading new secondary impacts. The positive news is that the total number of claims, including continuing claims, has resumed being “less awful,” likely meaning more people have been recalled to their jobs than have newly lost them. First, here are initial jobless claims both seasonally adjusted (blue) and non- seasonally adjusted (red). The non-seasonally adjusted number is of added importance since seasonal adjustments should not have
Topics:
NewDealdemocrat considers the following as important: Taxes/regulation, US/Global Economics
This could be interesting, too:
Joel Eissenberg writes How Tesla makes money
Angry Bear writes True pricing: effects on competition
Angry Bear writes The paradox of economic competition
Angry Bear writes USMAC Exempts Certain Items Coming out of Mexico and Canada
Initial jobless claims improve slightly; continuing claims resume decline
Weekly initial and continuing jobless claims give us the most up-to-date snapshot of the continuing economic impacts of the coronavirus on employment. More than three full months after the initial shock, the overall damage remains huge, with large spreading new secondary impacts. The positive news is that the total number of claims, including continuing claims, has resumed being “less awful,” likely meaning more people have been recalled to their jobs than have newly lost them.
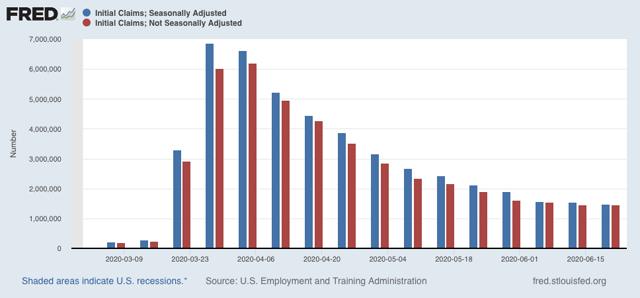
First, here are initial jobless claims both seasonally adjusted (blue) and non- seasonally adjusted (red). The non-seasonally adjusted number is of added importance since seasonal adjustments should not have more than a trivial effect on the huge real numbers:
 Figure 1
There were 1.457 million new claims, only 6,000 less than one week ago. After seasonal adjustment, this became 1.480 million, “only” 60,000 less than last week’s number. While the trend of the past 45 days of slight declines in new claims continues, this is the smallest weekly decline since the worst reading in April. Further, this objectively continues to show huge second-order impacts continuing to spread.
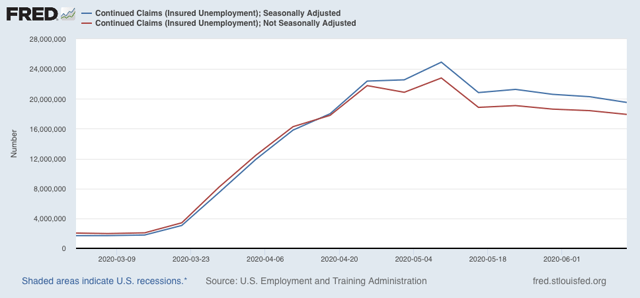
Meanwhile, after several weeks of no significant change, the “less bad” trend in continuing claims, which lag one week behind, has reappeared. In the previous four weeks, both the non-seasonally adjusted number (red), and the less important seasonally adjusted number (blue) had remained nearly stationary. This week the former declined by to 17,921 million, 4.873 million below its peak of 24.912 million five weeks ago; while the latter declined by 767,000 to 19.522 million, 5.390 million below its peak of 24.912 million reading five weeks ago:

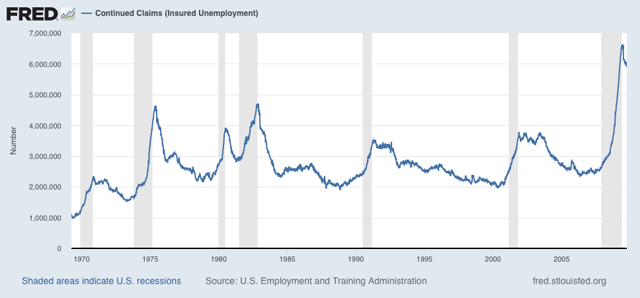
Historically initial claims have peaked several months before the end of recessions, and continuing claims have peaked at the end of or just after the end of recessions. Here’s the graph of continuing claims showing that from the beginning of the series through 2009:

For the moment at least, this indicates that the economy – and the jobs market – was at its “most awful” in late April or early May, and has gotten “less awful” since. Thus we should expect another positive number in the June jobs report that will be released one week from today.
But because there is now overwhelming evidence of renewed exponential spread by the coronavirus in States that recklessly reopened, all of the improving economic data may come to an abrupt end in the next few weeks. For example, although he has stopped short of an order, even Texas’s Trumpist governor has now recommended that people voluntarily “shelter in place” again.
