The Philly Fed state-by-state diffusion index of economic expansion This comes from the Philly Fed’s state-by-state coincident index, via Bill McBride. The graph below shows the number of states showing increasing economic activity: In December the number of states in expansion was 39. Historically over the past 40 years, that number dropping to 35 or below has (with the exception of one month in 1986) been the marker of the onset of a recession. Note the number is below the lowest level from 2015-16, in which weakness was generally confined to the Oil patch. It is yet another marker of a slowdown, but not of a recession. Later this morning we’ll get the January ISM manufacturing report, and over the next 48 hours we’ll get reports on January auto
Topics:
NewDealdemocrat considers the following as important: Taxes/regulation, US/Global Economics
This could be interesting, too:
Joel Eissenberg writes How Tesla makes money
Angry Bear writes True pricing: effects on competition
Angry Bear writes The paradox of economic competition
Angry Bear writes USMAC Exempts Certain Items Coming out of Mexico and Canada
The Philly Fed state-by-state diffusion index of economic expansion
This comes from the Philly Fed’s state-by-state coincident index, via Bill McBride. The graph below shows the number of states showing increasing economic activity:
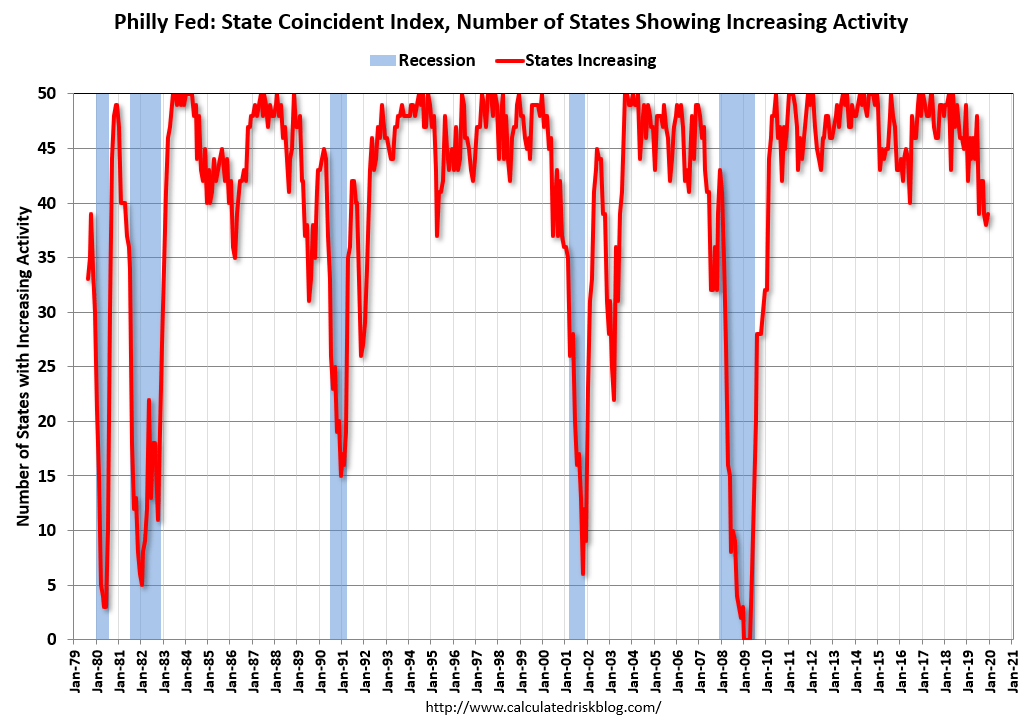
In December the number of states in expansion was 39. Historically over the past 40 years, that number dropping to 35 or below has (with the exception of one month in 1986) been the marker of the onset of a recession.
Note the number is below the lowest level from 2015-16, in which weakness was generally confined to the Oil patch. It is yet another marker of a slowdown, but not of a recession.
Later this morning we’ll get the January ISM manufacturing report, and over the next 48 hours we’ll get reports on January auto and truck sales. Both of these will help tell us if the weakness in the production sector has been spreading or not.