April housing permits and starts: a pullback from peak, but no recessionary signal UPDATED The monthly statistics on housing permits and starts, reported this morning, were mixed, as permits increased slightly and starts declined: The less volatile single-family permits also declined slightly. On the one hand, a high level of construction activity is continuing. But the three-month moving average of both single-family and total permits, as well as starts, all declined from their highs in the December-January period. To be recessionary, I would need to see at least a 10% decline in total permits; the actual decline from the peak is about 6%, so well within the range of a little pullback during an expansion. I’ll have more to say
Topics:
NewDealdemocrat considers the following as important: housing permits and starts, US EConomics, US/Global Economics
This could be interesting, too:
NewDealdemocrat writes JOLTS revisions from Yesterday’s Report
Bill Haskell writes The North American Automobile Industry Waits for Trump and the Gov. to Act
Bill Haskell writes Families Struggle Paying for Child Care While Working
Joel Eissenberg writes Time for Senate Dems to stand up against Trump/Musk
April housing permits and starts: a pullback from peak, but no recessionary signal UPDATED
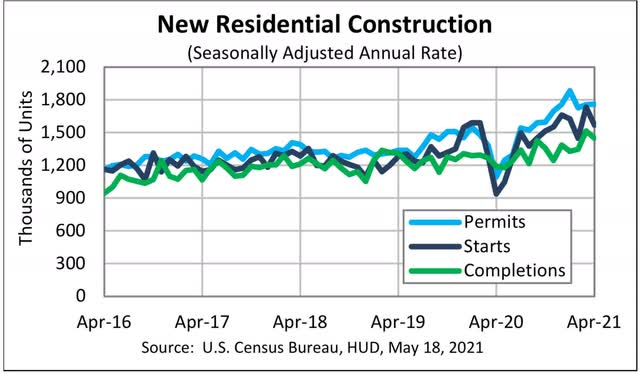
The monthly statistics on housing permits and starts, reported this morning, were mixed, as permits increased slightly and starts declined:

The less volatile single-family permits also declined slightly.
On the one hand, a high level of construction activity is continuing. But the three-month moving average of both single-family and total permits, as well as starts, all declined from their highs in the December-January period. To be recessionary, I would need to see at least a 10% decline in total permits; the actual decline from the peak is about 6%, so well within the range of a little pullback during an expansion.
I’ll have more to say once the data is posted at FRED, probably later today.
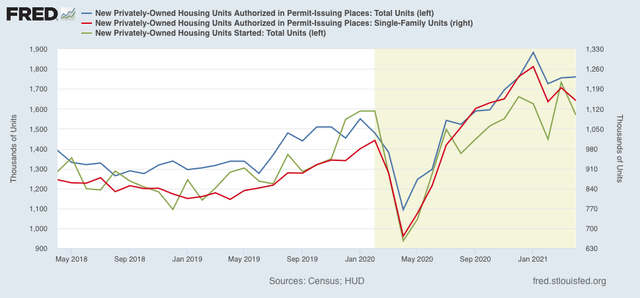
UPDATE: Here is the comparison of single family permits (red, right scale) – the least volatile of the measures – with total permits (blue) and starts (green) – which are about twice as volatile as permits and typically lag by a month or so:

The December 2020 – January 2021 peak is evident.
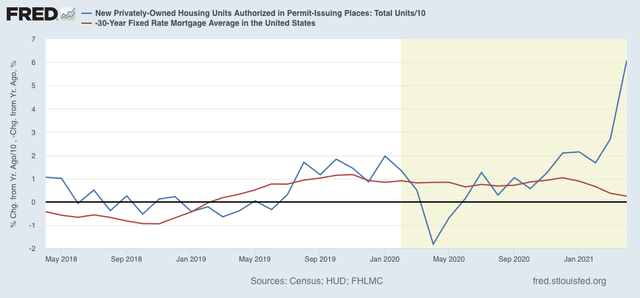
And here is the YoY change in mortgage rates (red), inverted so that up = economic positive, and down = economic negative, compared with total permits (blue)/10 for scale:

As I have said many times before, mortgage rates lead permits and starts. The artifact of comparisons with the pandemic lockdown months will end in June, at which time I expect permits to be only about 5% ahead of summer 2020 (= .5% on the graph).
