Coronavirus dashboard for August 11: evidence that the Delta wave may be peaking in the earliest hit States My framework of analyzing the economy via leading, coincident, and lagging indicators continues to come in handy at looking at the course of the pandemic. At the beginning of June, I flagged that the number of cases had stopped declining among 5 of the least vaccinated States. By the middle of June, I wrote that Delta was going to be a real challenge for those States. More pointedly, on June 23, I wrote that the Delta wave was beginning in those States, including Missouri, Arkansas, Nevada, Oklahoma, and Utah. Sure enough, as the days went by, more and more States showed increasing cases as Delta took hold. By the end of June, I was
Topics:
NewDealdemocrat considers the following as important: delta virus, Healthcare
This could be interesting, too:
Bill Haskell writes Families Struggle Paying for Child Care While Working
Joel Eissenberg writes RFK Jr. blames the victims
Joel Eissenberg writes The branding of Medicaid
Bill Haskell writes Why Healthcare Costs So Much . . .
Coronavirus dashboard for August 11: evidence that the Delta wave may be peaking in the earliest hit States
My framework of analyzing the economy via leading, coincident, and lagging indicators continues to come in handy at looking at the course of the pandemic.
At the beginning of June, I flagged that the number of cases had stopped declining among 5 of the least vaccinated States. By the middle of June, I wrote that Delta was going to be a real challenge for those States. More pointedly, on June 23, I wrote that the Delta wave was beginning in those States, including Missouri, Arkansas, Nevada, Oklahoma, and Utah. Sure enough, as the days went by, more and more States showed increasing cases as Delta took hold. By the end of June, I was warning that the end of July was going to look very different, and by late in July I was warning that the US was on track for 1000 deaths/day by the end of August (as of this morning, deaths are up to 545).
Consistent with the idea that Delta has been burning through the dry tinder, as demonstrated by the sharp peaks and declines in India and the UK, I have been looking for signs of when the peak might come in those early States hit with Delta. And the signs now look like they are showing up.
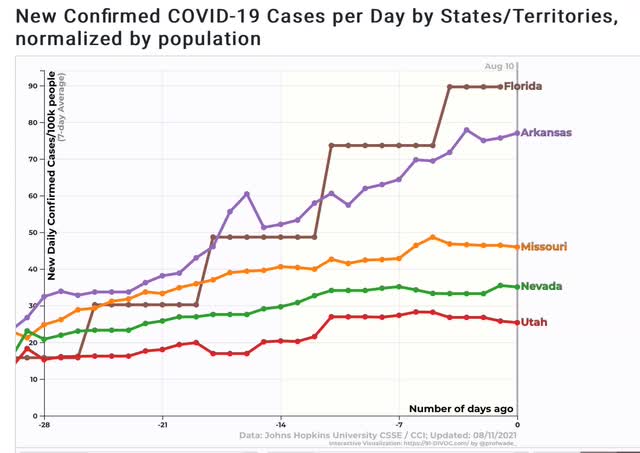
Here are the 7-day averages in new cases in 4 of the earliest hit States – Missouri, Arkansas, Nevada, and Utah, plus Florida as well. In 3 of the States – Missouri, Nevada, and Utah – new cases look completely flat over the past 7 to 10 days. In the other two, the rate of growth appears to be decelerating:

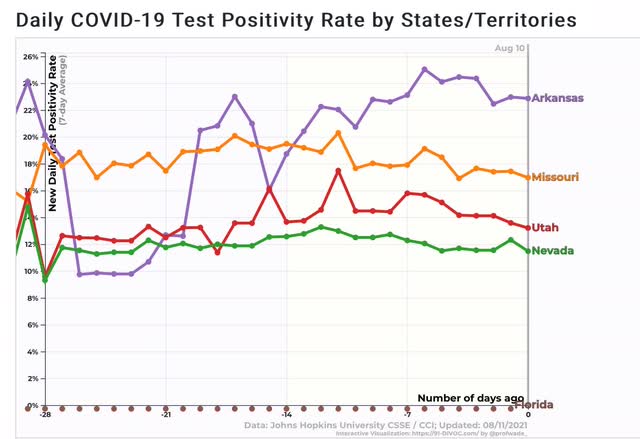
The ratio of positive to total COVID tests in 4 of those also appears to have peaked (Florida no longer bothers to report):

This is pretty strong evidence that the Delta wave is peaking in those States.
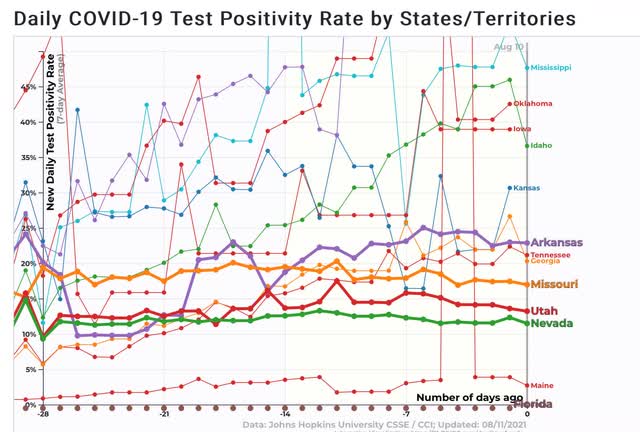
Turning our attention further to the ratio of positive to total tests, here is a graph of the 10 States with the highest ratio, in addition to the 5 already examined:

We have 5 States over 30% – Mississippi, Oklahoma, Iowa, Idaho, and Kansas.
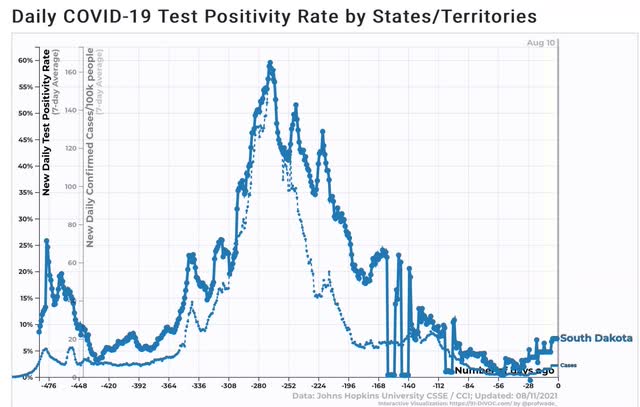
Let’s compare this to the signal case of South Dakota:

South Dakota’s positivity ratio peaked at 60% during its horrific outbreak last autumn. Right now South Dakota is averaging 6 cases per 100,000 per day, the lowest of any State in the nation.
As I have speculated a number of times, South Dakota may have stumbled into herd immunity, or at least close to it, the hard way. The positivity rates in the worst-hit States for Delta suggest that some of them at least, may not be far behind.
Once Delta burns through the dry tinder nationwide, which is looking more and more to happen sometime around Labor Day, just what % of all Americans have actually been infected by COVID becomes determinative in what is likely to happen next.
