House price increases continue to show strong market at the end The last housing market data for 2021, the FHFA and Case Shiller house price indexes, were reported this morning. Both showed a very slight deceleration in the soaring prices that have marked this year. The FHFA purchase-only index rose 1.1% for October. The YoY% increase was 17.4%, down from the 19.3% YoY peak in July. Meanwhile the Case Shiller national index rose 0.8% m/m, and is up 19.1% YoY, vs. its peak of 19.8% in August. This is similar to what we have already seen with the median prices of new houses for sale (gold): As I always note, prices follow sales. Below are new home sales and single-family housing permits (red, /2 for scale) vs. the FHFA index as above: As
Topics:
NewDealdemocrat considers the following as important: Housing Prices, US EConomics
This could be interesting, too:
NewDealdemocrat writes JOLTS revisions from Yesterday’s Report
Bill Haskell writes The North American Automobile Industry Waits for Trump and the Gov. to Act
Bill Haskell writes Families Struggle Paying for Child Care While Working
Joel Eissenberg writes Time for Senate Dems to stand up against Trump/Musk
House price increases continue to show strong market at the end
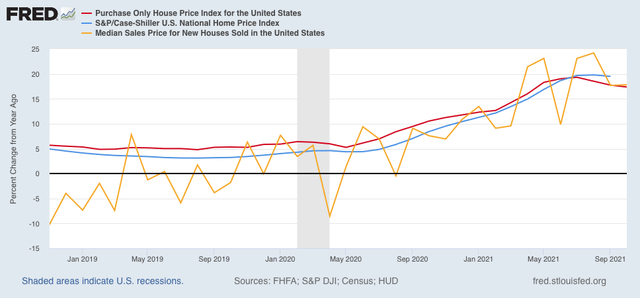
The last housing market data for 2021, the FHFA and Case Shiller house price indexes, were reported this morning. Both showed a very slight deceleration in the soaring prices that have marked this year.
The FHFA purchase-only index rose 1.1% for October. The YoY% increase was 17.4%, down from the 19.3% YoY peak in July. Meanwhile the Case Shiller national index rose 0.8% m/m, and is up 19.1% YoY, vs. its peak of 19.8% in August. This is similar to what we have already seen with the median prices of new houses for sale (gold):
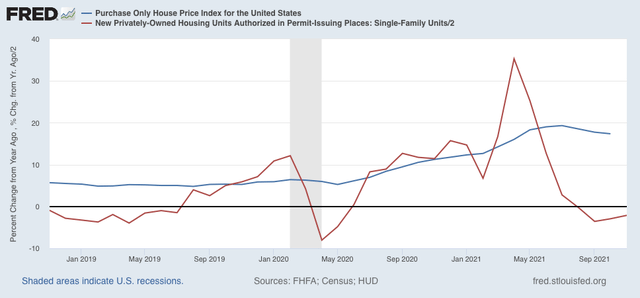
As I always note, prices follow sales. Below are new home sales and single-family housing permits (red, /2 for scale) vs. the FHFA index as above:
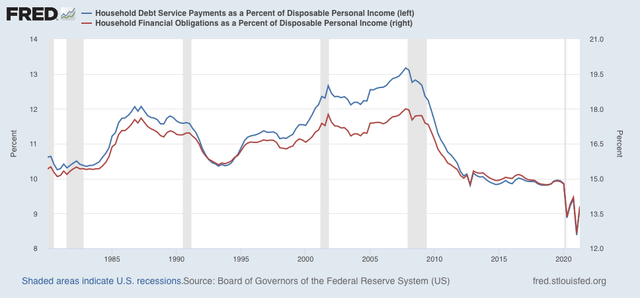
As expensive as houses are, they have not yet reached a crisis point as they did in 2006. This is because, although both average hourly wages and house price have increased roughly 60% since that time, mortgage rates, are just over 3% vs. 6.5% or higher back then. In other words, the amount of disposable income it takes the average household to service their mortgage and other debts in 2021 is only about 2/3’s of what it was at the peak of the housing bubble in 2006:
So while both single-family housing permits and new home sales have been down as much as 30% this year from their peak at the end of last year, they remain even with their best performance in the entire decade leading up to the pandemic:
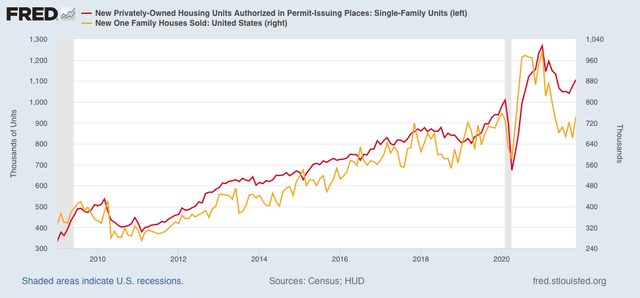
This is not a housing market that is in any serious trouble. While the downturn in housing activity this year will create a drag on the economy next year, it is very unlikely to put the economy as a whole into a recession.