This may be the most important housing chart of springtime 2021 My longform housing market analysis is almost complete, and will probably get posted later today or tomorrow at Seeking Alpha. I’ll post a link here once that is done. In the meantime, consider the following. The Case Shiller national house price index had another sharp increase in February, and is now up 11.2% YoY, the highest rate since the days of the housing bubble in 2002 (green in the graph below): Meanwhile, look at inventory (gold). In absolute terms, the seasonally adjusted inventory of new homes for sale bottomed last August and October. Last August inventory was down -12.3% YoY. As of last month, it was only down -4.6% YoY. At this rate of change, it will be *up* YoY
Topics:
NewDealdemocrat considers the following as important: housing and domestic demand, US EConomics, US/Global Economics
This could be interesting, too:
NewDealdemocrat writes JOLTS revisions from Yesterday’s Report
Bill Haskell writes The North American Automobile Industry Waits for Trump and the Gov. to Act
Bill Haskell writes Families Struggle Paying for Child Care While Working
Joel Eissenberg writes Time for Senate Dems to stand up against Trump/Musk
This may be the most important housing chart of springtime 2021
My longform housing market analysis is almost complete, and will probably get posted later today or tomorrow at Seeking Alpha. I’ll post a link here once that is done.
In the meantime, consider the following. The Case Shiller national house price index had another sharp increase in February, and is now up 11.2% YoY, the highest rate since the days of the housing bubble in 2002 (green in the graph below):
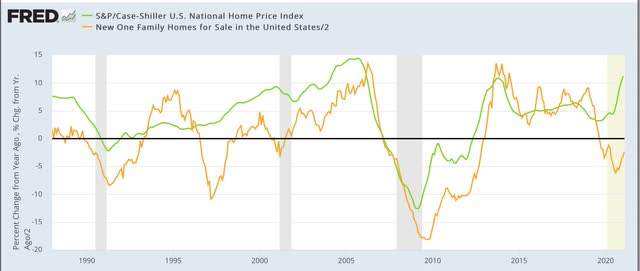 Meanwhile, look at inventory (gold). In absolute terms, the seasonally adjusted inventory of new homes for sale bottomed last August and October. Last August inventory was down -12.3% YoY. As of last month, it was only down -4.6% YoY. At this rate of change, it will be *up* YoY by about May.
Multiple offers over asking prices within days if not hours are now becoming common. We are experiencing the hottest “seller’s market” in housing since the bubble.
A sharp break in house prices and inventory levels is likely to be the biggest “surprise” in the housing market between now and Labor Day.