RJS at Marketwatch 666 reviews oil and natural gas pricing, June 28, 2021 Oil Pricing Oil prices set a new 32 month high for a fifth consecutive week, as negotiations to lift Iranian sanctions broke off and US crude supplies fell more than was expected for a fifth straight week. After rising 1% to .64 a barrel last week on rising demand and falling supplies, the contract price of US light sweet crude for July delivery opened lower on Monday on Fed comments late last week that they might start raising rates by 2023, but then jumped by the most in a month to finish .02 higher at a 32 month high of .66 a barrel as the US dollar fell from two month highs while US talks with Iran wrapped up without resolution, thus leaving Iranian oil
Topics:
run75441 considers the following as important: Hot Topics, MarketWatch 666, natural gas, Oil, politics, RJS, US/Global Economics
This could be interesting, too:
Robert Skidelsky writes Lord Skidelsky to ask His Majesty’s Government what is their policy with regard to the Ukraine war following the new policy of the government of the United States of America.
NewDealdemocrat writes JOLTS revisions from Yesterday’s Report
Joel Eissenberg writes No Invading Allies Act
Ken Melvin writes A Developed Taste
RJS at Marketwatch 666 reviews oil and natural gas pricing, June 28, 2021
Oil Pricing
Oil prices set a new 32 month high for a fifth consecutive week, as negotiations to lift Iranian sanctions broke off and US crude supplies fell more than was expected for a fifth straight week.
After rising 1% to $71.64 a barrel last week on rising demand and falling supplies, the contract price of US light sweet crude for July delivery opened lower on Monday on Fed comments late last week that they might start raising rates by 2023, but then jumped by the most in a month to finish $2.02 higher at a 32 month high of $73.66 a barrel as the US dollar fell from two month highs while US talks with Iran wrapped up without resolution, thus leaving Iranian oil supplies in doubt…however, oil prices fell slightly on Tuesday amid profit taking after Monday’s price surge and settled 60 cents lower, as trading in the July oil contract expired with oil priced at $73.06 a barrel, while the more-actively traded August oil contract fell 27 cents to $72.85 a barrel on expectations that OPEC+ might decide to further boost crude production starting in August….but oil prices rebounded in after hours trading Tuesday after the American Petroleum Institute reported a much larger than expected withdrawal from crude inventories, and hence the contract price of US light sweet crude for August delivery opened higher on Wednesday, but failed to extend its overnight gains even though the EIA reported an equally large draw, and settled just 23 cents higher at $73.08 a barrel, as traders noted that technical indicators showed that oil was overbought…nonetheless, oil prices continued moving higher Thursday, closing in on their highest in almost three years, on the drawdowns in U.S. inventories and on accelerating German economic activity. and finished the session 22 cents higher at $73.30 a barrel, as positive sentiment over an infrastructure deal announced by the Biden administration overcame concerns about possible additional supply announcements at next week’s OPEC meeting…oil prices pulled back early Friday with all eyes on the OPEC, Russia and other producers meeting next week, but then rallied into the close to settle 75 cents higher at $74.05 a barrel on expectations that demand growth would outstrip supplies, which were continuing to tighten in the U.S. and China….oil prices thus posted their fifth straight weekly gain, the longest winning streak this year, in rising 3.4% to the highest level since early October 2018, while the August oil contract, which had closed at $71.29 a barrel last week, saw its price end this week 3.9% higher.
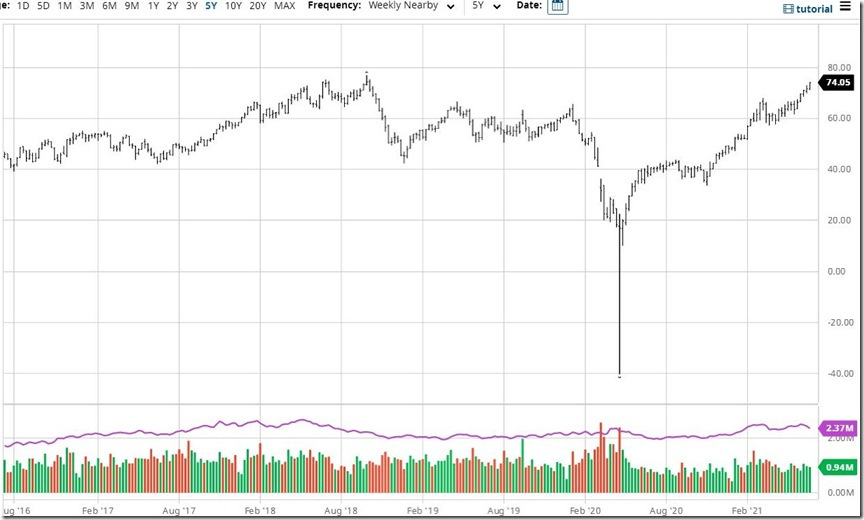
The above is a screenshot of the interactive oil price chart from barchart.com, which i have set to show front month oil prices weekly over the past 5 years, which means you’re seeing prices as they were quoted in the media…this same chart can be reset to show prices of front month or individual monthly oil contracts over time periods ranging from 1 day to 30 years, as the menu bar on the top indicates, and also to show oil prices by the minute, hour, day, week or month for each…each bar in the graph represents the range of oil prices for the week, while the bars across the bottom show trading volume for the weeks in question, with down weeks indicated by red bars and up weeks indicated in green…although it’s a bit hard to see with 5 years all squashed together, there were only two weeks on this graph when prices exceeded this week’s; the week ending July 2nd, 2018, when oil hit a high of $75.27 a barrel. and the week ending October 1st, 20018, when oil prices briefly spurted to $76.90 a barrel….to find higher prices before that, we have to get back to early November 2014, before the Thanksgiving meeting at which OPEC began an attempt to flood the global markets, hoping to put US shale out of business…on the other hand, we can also see how prices briefly dropped to negative $40 during the 3rd week of April last year, when the OPEC agreement broke down during a squabble between Russia and the Saudis, and when oil was again dumped on a world in lockdown, with no place left to store the excess.
Natural Gas Pricing
Meanwhile, natural gas prices finished higher for the 10th time in twelve weeks in rising to a 29 month high, as exports rose and domestic inventories remained well below normal….after falling 2.5% to $3.215 per mmBTU last week as cooler weather was forecast and utilities began switching to cheaper coal, the contract price of natural gas for July delivery opened lower on Monday and slid 2.4 cents to $3.191 per mmBTU, as less heat was forecast to reach the lower 48 than had previously been expected…but natural gas prices rose 6.7 cents to $3.258 per mmBTU on Tuesday as gas prices in Europe and Asia both topped $10 per mmBTU, leading to expectations US LNG exports would be at record levels this summer…natural gas rallied again on Wednesday as export demand rose sharply following maintenance, and gas production dipped lower for the second straight day, and prices settled 7.5 cents higher at $3.333 natural gas prices were then up another 8.5 cents to $3.418 per mmBTU after opening lower on Thursday, as a very tight government inventory report sparked an initial price rebound, and forecast heat through the first full week of July sent futures surging later in the session.…gas prices opened higher and continued rising on Friday before settling another 7.8 cents higher at $3.496 per mmBTU, as sweltering heat and revived export demand pointed to even tighter balances ahead of the peak summer cooling season, with natural gas thus finishing the week up 8.7% at a fresh 29 month high.

Like the oil chart above, this is a screenshot of the interactive natural gas price chart from barchart.com, again set to show front month natural gas prices weekly over the past 5 years, which again means you’re seeing natural gas prices as they were quoted daily…again, this chart can also be reset to show prices of front month or individual monthly natural gas contracts over time periods ranging from 1 day to 30 years, and also to show natural gas prices by the minute, hour, day, week or month for each…while this week’s natural gas prices were indeed the highest since January 2019, they come nowhere close to matching the $4.50 to $5 per mmBTU price range we saw in November 2018, when a brutally cold month resulted in an early drawdown of supplies, raising concerns of shortages going into that winter, which persisted until milder weather arrived in late December and January.
The natural gas storage report from the EIA for the week ending June 18th indicated that the amount of natural gas held in underground storage in the US rose by 55 billion cubic feet to 2,482 billion cubic feet by the end of the week, which thus left our gas supplies 513 billion cubic feet, or 17.1% below the 2,995 billion cubic feet that were in storage on June 18th of last year, and 154 billion cubic feet, or 5.8% below the five-year average of 2,636 billion cubic feet of natural gas that have been in storage as of the 18th of June in recent years… the 55 billion cubic feet increase in US natural gas in storage this week was below the average forecast of a 63 billion cubic foot addition from an S&P Global Platts survey of analysts, and was further below the average addition of 83 billion cubic feet of natural gas that have typically been injected into natural gas storage during the second week of June over the past 5 years, as well as far below the 115 billion cubic feet that were added to natural gas storage during the corresponding week of 2020.