Scenes from the December jobs report Friday’s December jobs report saw the first decline in employment since the lockdowns of March and April. Let’s take a closer look.As I pointed out Friday, the losses were concentrated in the food and dining (restaurant) and amusement and recreation sectors, both of which are shown below normalized to 100 as of February: The two sectors are down 20% and 30% from their February peaks.By contrast, the leading job sectors of manufacturing, residential and overall construction, and temporary help positions all continued with gains, and are close to if not completely recovered from their pandemic losses. Below I show these YoY in two time periods for easier comparison (note two of the series did not begin until
Topics:
NewDealdemocrat considers the following as important: US EConomics, US/Global Economics
This could be interesting, too:
NewDealdemocrat writes JOLTS revisions from Yesterday’s Report
Bill Haskell writes The North American Automobile Industry Waits for Trump and the Gov. to Act
Bill Haskell writes Families Struggle Paying for Child Care While Working
Joel Eissenberg writes Time for Senate Dems to stand up against Trump/Musk
Scenes from the December jobs report
Friday’s December jobs report saw the first decline in employment since the lockdowns of March and April. Let’s take a closer look.
As I pointed out Friday, the losses were concentrated in the food and dining (restaurant) and amusement and recreation sectors, both of which are shown below normalized to 100 as of February:

The two sectors are down 20% and 30% from their February peaks.
By contrast, the leading job sectors of manufacturing, residential and overall construction, and temporary help positions all continued with gains, and are close to if not completely recovered from their pandemic losses. Below I show these YoY in two time periods for easier comparison (note two of the series did not begin until the 1980s).
1955-1982:

1983 – present:
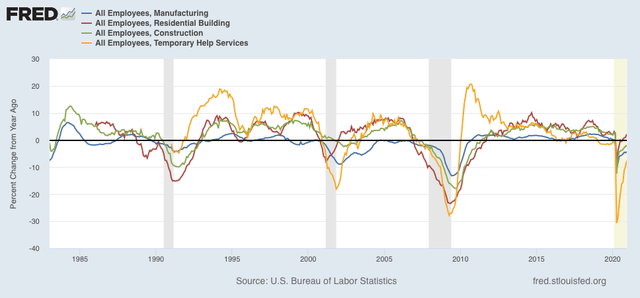
This is one of the many signs pointing to a strong rebound in the overall economy once the pandemic is brought under control.
Another important way to look at employment is via the differential impact of the pandemic on the goods-producing vs. service-providing sectors of the economy. Below are the YoY% changes also broken down into two time periods for easier comparison.
1955-1982:

1983 – present:
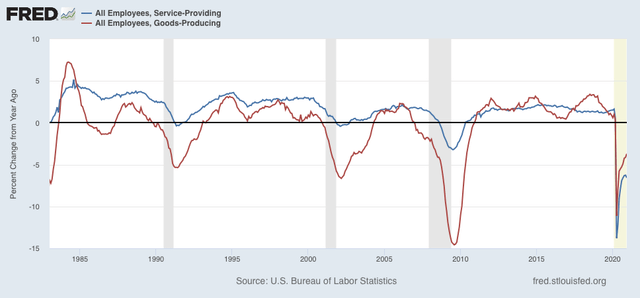
Up until the Great Recession, the goods-producing sector always bore the brunt of layoffs. In fact, the worst YoY losses in service jobs were 1.4% in 1949 and 1.3% in 1958, respectively. In 2009, by contrast, the worst losses were 3.2%. Last year, there were 13.8% losses in April, improving to their “best” reading of 6.3% losses in November.
Finally here are the breakdowns in YoY job gains and losses between men (blue) and women (red), divided into the same two time periods:
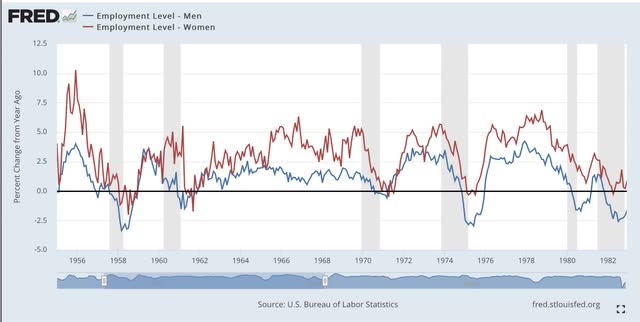
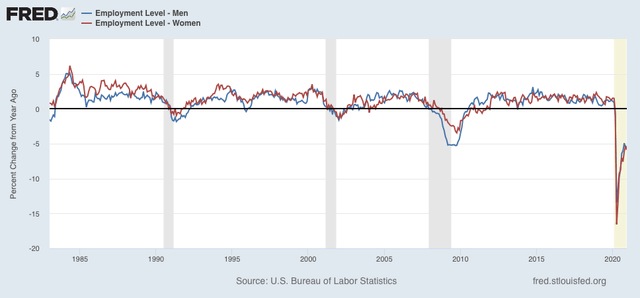
Because women have disproportionately been employed in the lower-paying service sectors, they did not suffer layoffs *relatively* as bad as men during recessions prior to the turn of the Millennium. This got worse during the Great Recession, and in this pandemic recession, they have been hit the worst of all historically.