Coronavirus dashboard for October 20: as the Delta downtrend slows, is any State closing in on “herd immunity”? It’s been a moment since my last dashboard. That’s primarily because the Columbus Day weekend resulted in anomalies for the past 9 days, that have finally mainly but not completely resolved. Here’s a look at the past 6 months for both cases and deaths per 100,000: As of today, cases are finally down more than 50% from the Delta peak, at just over 80,000. But as you can see, they are still well above their 11,300 minimum in late June. Deaths are still just under 1700, an elevated number that is the highest since early March. Here’s a close-up of the past 8 weeks: I am showing you so you can see that the lack of
Topics:
NewDealdemocrat considers the following as important: delta variant, Healthcare, herd immunity
This could be interesting, too:
Bill Haskell writes Families Struggle Paying for Child Care While Working
Joel Eissenberg writes RFK Jr. blames the victims
Joel Eissenberg writes The branding of Medicaid
Bill Haskell writes Why Healthcare Costs So Much . . .
Coronavirus dashboard for October 20: as the Delta downtrend slows, is any State closing in on “herd immunity”?
It’s been a moment since my last dashboard. That’s primarily because the Columbus Day weekend resulted in anomalies for the past 9 days, that have finally mainly but not completely resolved.
Here’s a look at the past 6 months for both cases and deaths per 100,000:
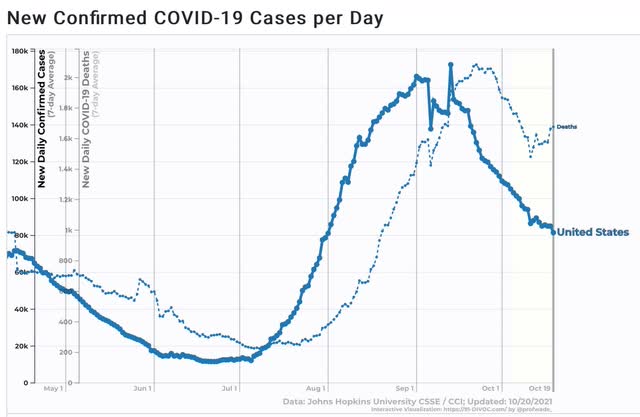
As of today, cases are finally down more than 50% from the Delta peak, at just over 80,000. But as you can see, they are still well above their 11,300 minimum in late June. Deaths are still just under 1700, an elevated number that is the highest since early March.
Here’s a close-up of the past 8 weeks:
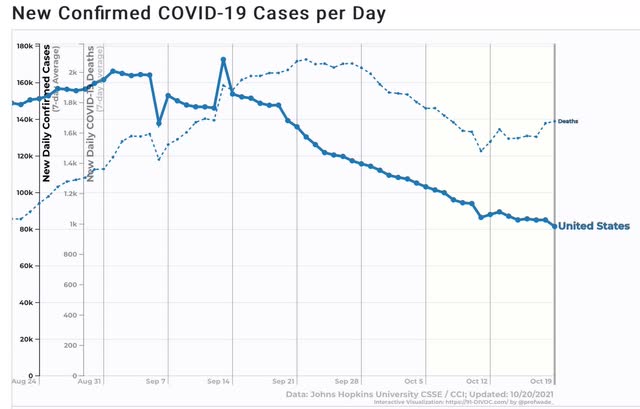
I am showing you so you can see that the lack of reporting on Columbus Day, to also in some States the day after as well, caused an anomalous decline those two days, followed by a spike, and then an anomalous bigger decline today as last Tuesday’s spike left the average. You can also see that many States don’t bother to report on the weekends anymore causes a flattening of those two days’ readings compared with trend. The next few days will reveal if there remains a true downward trend or not.
Here is what the four Census regions of the country look like over the past 12 months:
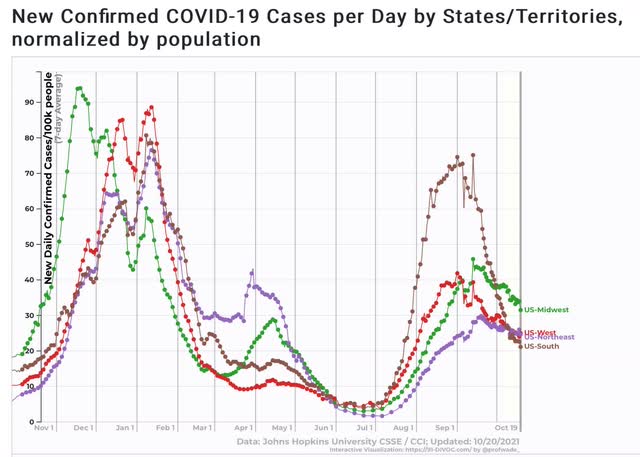
Note that the winter wave began at the beginning of October last year. There has been no such increase so far this month. If cases either trend downward or even sideways for another couple of weeks, we will be lower this year than last year heading into winter. Whether vaccinations + the Delta wave mute any winter wave (when people head indoors for social gatherings) this year is the big question over the next few months.
I have also been curious as to which States have been the closest to or furthest away from either “herd immunity” or “endemic Covid.” While I haven’t looked at all of them, I have compared the most extreme cases.
Those States with the most vaccinations tend to have had a low to moderate number of total infections (yes, that included NY and NJ). The two jurisdictions (omitting PR and various island territories) with the most vaccinations are DC and VT:
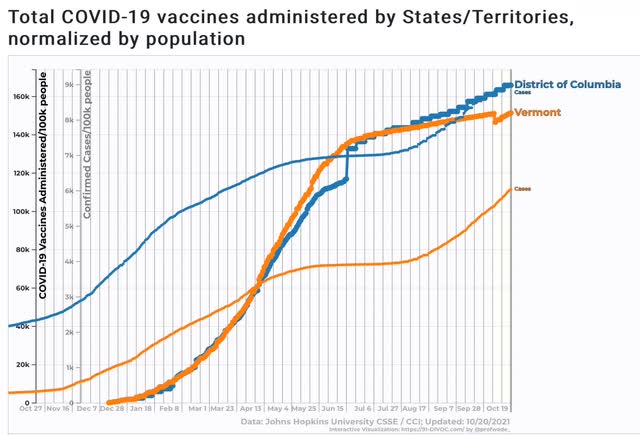
DC has 62% fully vaccinated, plus 10% partially so. VT has 71% fully plus 8% partially vaccinated. Only 9% of the population of DC has had a confirmed infection, and 6% of Vermont (both excellent number for the US).
If we figure that the total number of actual cases is 2.2x the confirmed count, that gives us a 20% infection rate for DC, and a 13% infection rate for VT. If we randomly assign those among fully, partially, and un-vaccinated people, that gives us the following:
DC: 64% immune,* plus 14% with some resistance, for a total of 78%, with 22% sitting ducks.VT: 73% immune,* plus 10% with some resistance, for a total of 83%, with 17% sitting ducks.*=obviously not totally so
At the other extreme, the two States with the highest number of confirmed cases are TN and ND, both with 18.5% confirmed infection rates (suggesting that 41% of their populations have actually been infected. TN has 47% fully, plus 7% partially vaccinated. ND has 45% fully, plus another 7% partially vaccinated:
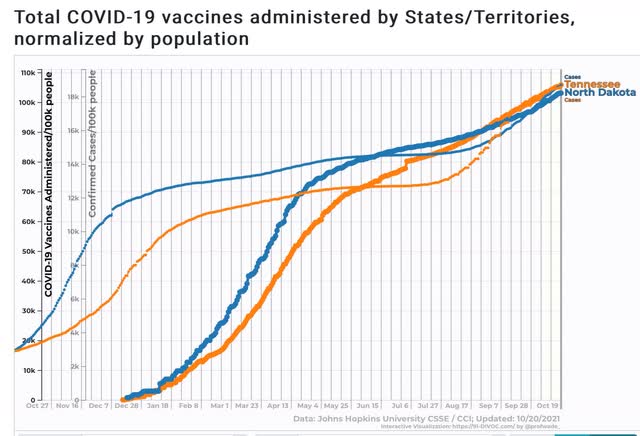
That gives us:
TN: 50% immune, plus 24% with some resistance, for a total of 74%, with 26% sitting ducks.ND: 48% immune, plus 25% with some resistance, for a total of 73%, with 27% sitting ducks.
While there aren’t any States that have managed both low vaccination and low infection rates, there is one (small!) State which has both a very high vaccination rate and a very high previous infection rate: Rhode Island.
RI has 70% fully, and another 7% partially vaccinated. It also has a 16.5% confirmed infection rate, the 8th highest rate in the entire country, for a “real” number of 36%:
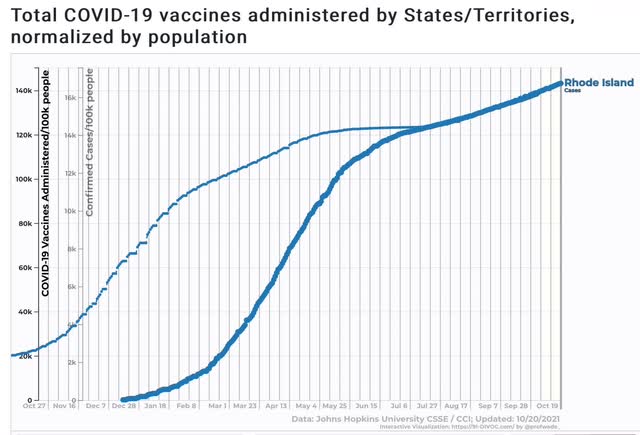
That gives us 73% immune, plus 12% with some resistance, for a total of 85%, with only 15% still sitting ducks (2% better than VT, 7% better than DC, and over 10% better than either TN or ND.
Once 5-11-year-olds are able to be vaccinated, that (hopefully) should add about another 8% to the totals of fully vaccinated. That would put both RI and VT over 90% either immune or with some resistance. That’s a point by which we should expect to see what an endemic COVID, if not “herd immunity” looks like.
