Coronavirus dashboard for year-end 2021: the Graph of the Year, where we are now, and where we are probably going At the end of the 2nd year of the pandemic, a little self-assessment of what I got right and wrong, where we are and where we are probably going. The one thing I got wrong in a big way is explained by this Coronavirus Graph of the Year: I thought sure that once the effectiveness of the vaccines was widely known, opposition and reluctance to taking them would sharply decline. I did not expect the volume and intensity and orchestration of the anti-science, anti-vax campaign by Fox News and RW nutjobs. As a result, since mid-April the number of people getting vaccinated steadily declined from 2 million per day in early April
Topics:
NewDealdemocrat considers the following as important: coronavirus and politics, coronavirus dashboard, Healthcare
This could be interesting, too:
Bill Haskell writes Families Struggle Paying for Child Care While Working
Joel Eissenberg writes RFK Jr. blames the victims
Joel Eissenberg writes The branding of Medicaid
Bill Haskell writes Why Healthcare Costs So Much . . .
Coronavirus dashboard for year-end 2021: the Graph of the Year, where we are now, and where we are probably going
At the end of the 2nd year of the pandemic, a little self-assessment of what I got right and wrong, where we are and where we are probably going.
The one thing I got wrong in a big way is explained by this Coronavirus Graph of the Year:
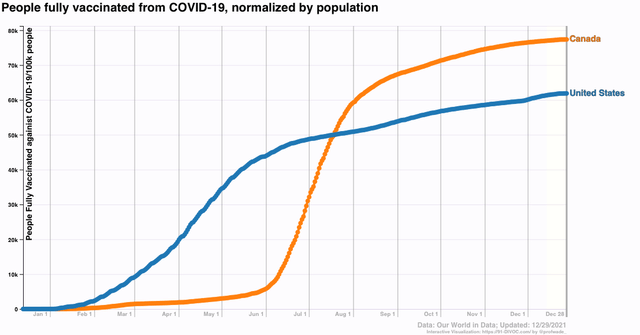
I thought sure that once the effectiveness of the vaccines was widely known, opposition and reluctance to taking them would sharply decline. I did not expect the volume and intensity and orchestration of the anti-science, anti-vax campaign by Fox News and RW nutjobs. As a result, since mid-April the number of people getting vaccinated steadily declined from 2 million per day in early April until by July it was only about 250,000 per day. Just stunning. And it never picked up meaningfully since, only hitting about 500,000 per day several times when new age groups were approved for the jab.
And as a result, when Delta and now Omicron appeared, they still had fertile ground in which to grow rampantly.
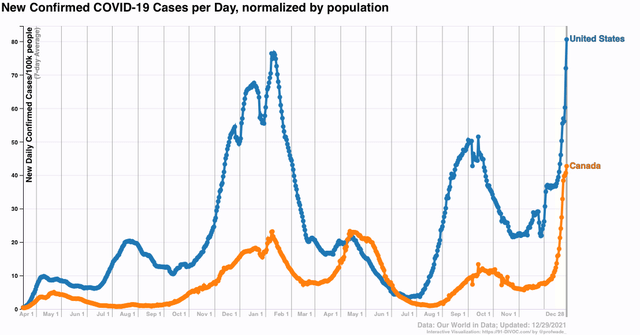
By contrast, our neighbor Canada started later, but much more quickly got to 2/3’s and then 3/4’s of their entire population being fully vaccinated. As a result, they had a much milder Delta wave:
With Omicron, unfortunately, it would probably take something like 90% of the population being fully vaccinated to keep it from taking off. Canada may get there, but the sad truth is, the US *never* will.
By contrast, I just about nailed the trajectory of the Delta wave, using India, Israel, and the UK as my “leading indicators.” In all three, it appeared that Delta took 1.5-2 months to crest, and another 1.5-2 months to retreat. I used that as a template for what would happen in the US, and indeed in the US, the Delta wave crested a little under 2 months after it started, and retreated for about 1.5 months thereafter. I was also in the ballpark very early about the number of daily cases and deaths at peak.
Now we are dealing with Omicron. I am hopeful (in the least-worst sort of way) that Omicron will do what Delta didn’t quite accomplish: infecting so many of the unvaccinated that a critical mass of the population builds up significant resistance to virulent repeat infections.
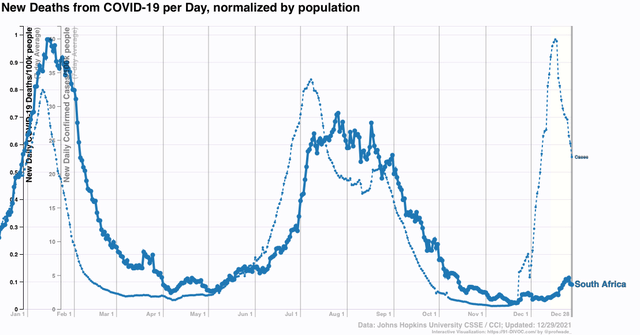
Here’s what the Omicron trajectory looks like in South Africa:
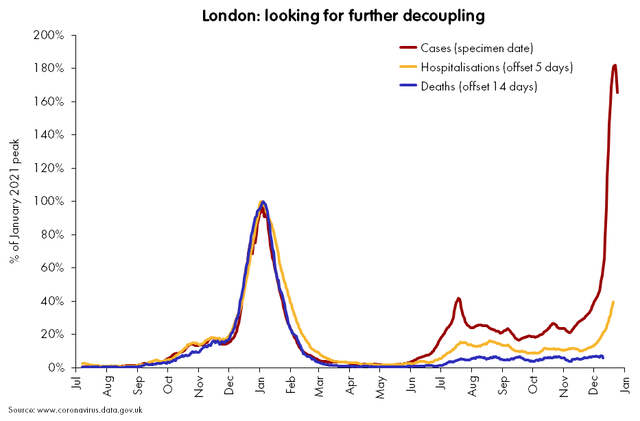
and here is London in the UK:
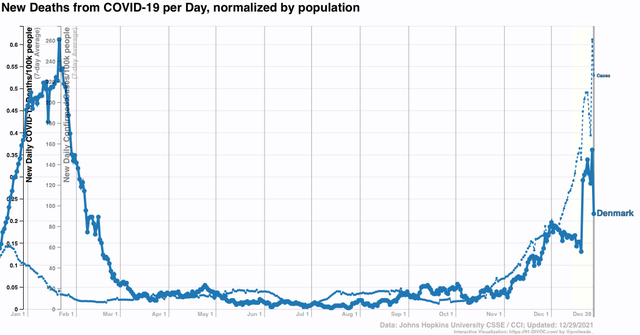
And here is Denmark, another early country where Omicron took off:
And finally, here is Puerto Rico, where over 80% of the population was fully vaccinated before Omicron:
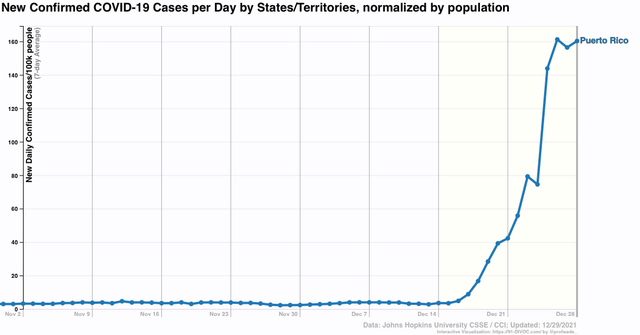
Puerto Rico, like Canada, shows that even 75% or 80% of a population fully vaccinated wasn’t enough to stop Omicron. But Puerto Rico, like South Africa, like London, and like Denmark, appears to show that Omicron rushes in like SuperDelta, peaking only 30-40 days after the initial cases. While it’s too soon to say for Canada or Puerto Rico, in the case of South Africa, and probably London and Denmark as well, there has been an order of magnitude fewer deaths than with prior similar waves of infection. The jury is still out on this, but as “leading indicators” these places give ample room for hope.
If the US as a whole follows South Africa and others, then Omicron will peak by early to mid-January, probably at 400,000 or more cases per day. But we might get lucky and never exceed the roughly 2200 mark of deaths daily set at the peak of Delta.
What then? The idea of eradication is long gone, not only because of how poorly so many humans have behaved in the US and elsewhere, but ultimately because the disease has ample additional animal reservoirs, such as deer and even house cats. Covid is going to become endemic. But as more and more people get infected with various strains, and more and more people are also vaccinated against those strains, it will find a smaller pool of people able to be infected. In other words, I expect successive waves to become smaller and smaller until ultimately COVID, while a big problem for people with poor immune systems, becomes part of the background noise of health.
Here again is the graph of the % of people fully vaccinated in the US, plus the total number of cases in the US, both on the same scale:
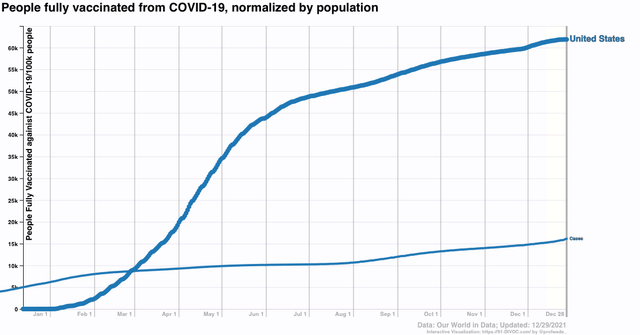
Since we know that about half of all COVID cases are asymptomatic, the likelihood is that 1/3rd or more of all Americans have been infected. And since the middle of the year, probably about 90% of those infected are among the unvaccinated.
On June 30, about 50% of people were fully vaccinated, and about 10% of the population had confirmed infections. Double that % of infections, and adjust for the fact that about 50% of prior infections were to people subsequently vaccinated, and you wind up with about 50%+10%, or 60% of the US population probably having some resistance. Fast forward to now, with about 62% of the population vaccinated, and another 6% of the population having subsequently been confirmed as infected, probably 90% of whom were unvaccinated, and you get 62% + 10% + (.9*2*6)% = 62%+10%+11%, or 83% of the US population with some resistance to COVID.
I think by the end of winter that last number could approach 90%. We may also get the last batch of young children approved for vaccination. In short, in other words, I am not fatalistic, and remain hopeful that by spring, the reservoir of easy pickings for COVID in the US will have shrunk enough that subsequent waves will be progressively smaller, and progressively less fatal.