Coronavirus dashboard for April 5: BA.2 likely only causes a ripple; and on track for record low daily deaths This is a good time to look at the impact – or, better speaking, the lack thereof – of the BA.2 Omicron variant in the US. Nationwide the 7 day average was 28,961 yesterday: This is the lowest since last July, and lower than all but about 3.5 months since the end of March 2020. Only late spring 2020 and from mid-May through mid-July 2021 were lower. In other words, on a national level, there is no BA.2 wave whatsoever yet. The above graph comes from The NY Times because the State of Kentucky decided to make an enormous data dump yesterday (like 190,000 cases and 2900 deaths!) yesterday, which is ruining the comparisons on
Topics:
NewDealdemocrat considers the following as important: BA.2, coronavirus, Healthcare, politics
This could be interesting, too:
Robert Skidelsky writes Lord Skidelsky to ask His Majesty’s Government what is their policy with regard to the Ukraine war following the new policy of the government of the United States of America.
Joel Eissenberg writes No Invading Allies Act
Ken Melvin writes A Developed Taste
Bill Haskell writes The North American Automobile Industry Waits for Trump and the Gov. to Act
Coronavirus dashboard for April 5: BA.2 likely only causes a ripple; and on track for record low daily deaths
This is a good time to look at the impact – or, better speaking, the lack thereof – of the BA.2 Omicron variant in the US.
Nationwide the 7 day average was 28,961 yesterday:
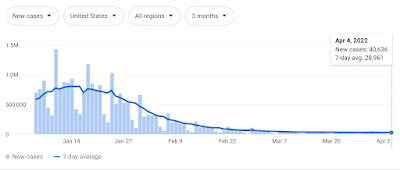
This is the lowest since last July, and lower than all but about 3.5 months since the end of March 2020. Only late spring 2020 and from mid-May through mid-July 2021 were lower. In other words, on a national level, there is no BA.2 wave whatsoever yet.
The above graph comes from The NY Times because the State of Kentucky decided to make an enormous data dump yesterday (like 190,000 cases and 2900 deaths!) yesterday, which is ruining the comparisons on my typical data source, 91-Divoc.
Omitting the South (and so KY), here are the regional breakdowns in cases, as well as NY, NJ, and MA, 3 of the States in the Northeast where there *has* been something of a BA.2 wave:
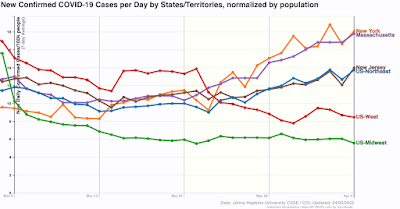
Note that for the Northeast as a whole, and NY in particular, cases are beginning to level off after 3 weeks. I mention this because the BA.2 wave in Europe has set the pattern for BA.2 impacts. Below are cases in the 5 big countries in Europe, as well as the EU as a whole:
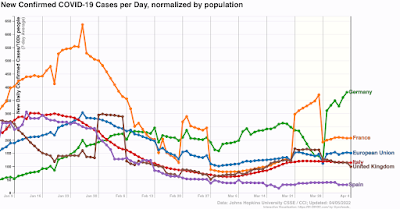
The BA.2 waves started between the end of February through the first week in March. In every country but Germany, they have already peaked. And Germany is misleading because they had a data dump 6 days ago. Without it, cases there would only be where they were 2 weeks ago. In other words, in Europe BA.2 waves, where they occurred, have only lasted 2.5-3.5 weeks.
Further, in Europe, the BA.2 waves generally peaked once the variant reached the level of 80%-90% of all cases. With that in mind, here is today’s update from the CDC of variance prevalence in the US, showing that BA.2 is not 72% of all cases, having risen about 15% in each of the past two weeks:
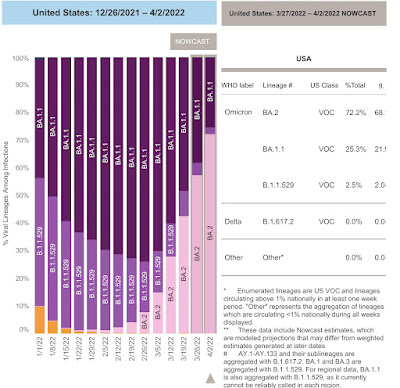
And here their map of the regional breakdown:
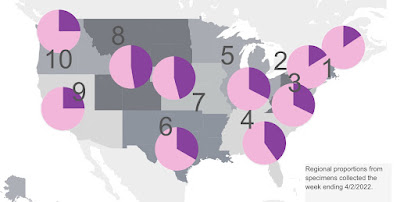
BA.2 makes up 75% of all cases on the West Coast (where there has been no discernible wave whatsoever) and 84% in the Northeast (New England + NY and NJ).
The Northeast is going to hit 90% or more BA.2 prevalence within a week. Above I mentioned that cases in the Northeast look like they are beginning to level off. I expect a peak to be obvious there within a week to 10 days. The rest of the country is probably about one or two weeks behind that.
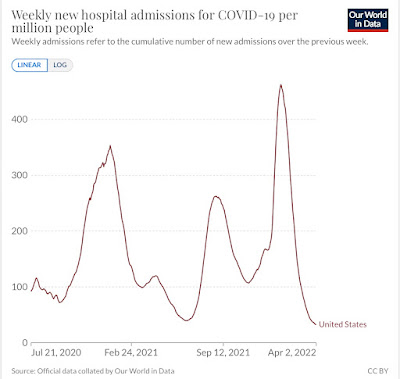
Turning to hospitalization admissions, they are at their lowest level ever during the pandemic, averaging 10,744/day during the past week:
And finally, here are deaths, currently averaging 604:
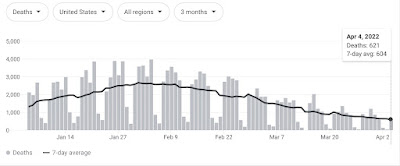
This is the lowest level since last August, and lower than all but 4 months of the past two years.
In conclusion, it now looks nearly certain that, on a national level, at worst there is going to be just a BA.2 ripple, and maybe just a long tail of a very slow decline from 30,000 cases daily.
Further, while deaths have declined at a far slower rate than cases, because cases are down over 96% from their Omicron high, and at peak there were only 2600 deaths a day from Omicron, a 96% decline in deaths would take us down to only about 100 per day. And because victims are typically hospitalized before they succumb, and hospitalizations are at new record lows, this further supports the hypothesis that we are perhaps only a month away from a new record low in daily deaths from COVID.
