RJS, MarketWatch 666 Retail Sales Rose 0.3 % in February After January’s Sales were Revised 1.0% Higher Seasonally adjusted retail sales increased 0.3% in February after retail sales for January were revised 1.0% higher . . . the Advance Retail Sales Report for February (above) from the Census Bureau estimated our seasonally adjusted retail and food services sales totaled 8.1 billion during the month, which was 0.3 percent (±0.5%)* higher than January’s revised sales of 6.1 billion, and 17.6 percent (±0.9 percent) above the adjusted sales in February of last year . . . January’s seasonally adjusted sales were revised up from 9.8 billion to 6.1 billion, while December’s sales were revised from 6.3 billion down to 5,459
Topics:
Angry Bear considers the following as important: Hot Topics, MarketWatch 666, Retail and Food Services Sales, RJS, US EConomics
This could be interesting, too:
NewDealdemocrat writes JOLTS revisions from Yesterday’s Report
Joel Eissenberg writes No Invading Allies Act
Bill Haskell writes The North American Automobile Industry Waits for Trump and the Gov. to Act
Bill Haskell writes Families Struggle Paying for Child Care While Working
RJS, MarketWatch 666
Retail Sales Rose 0.3 % in February After January’s Sales were Revised 1.0% Higher
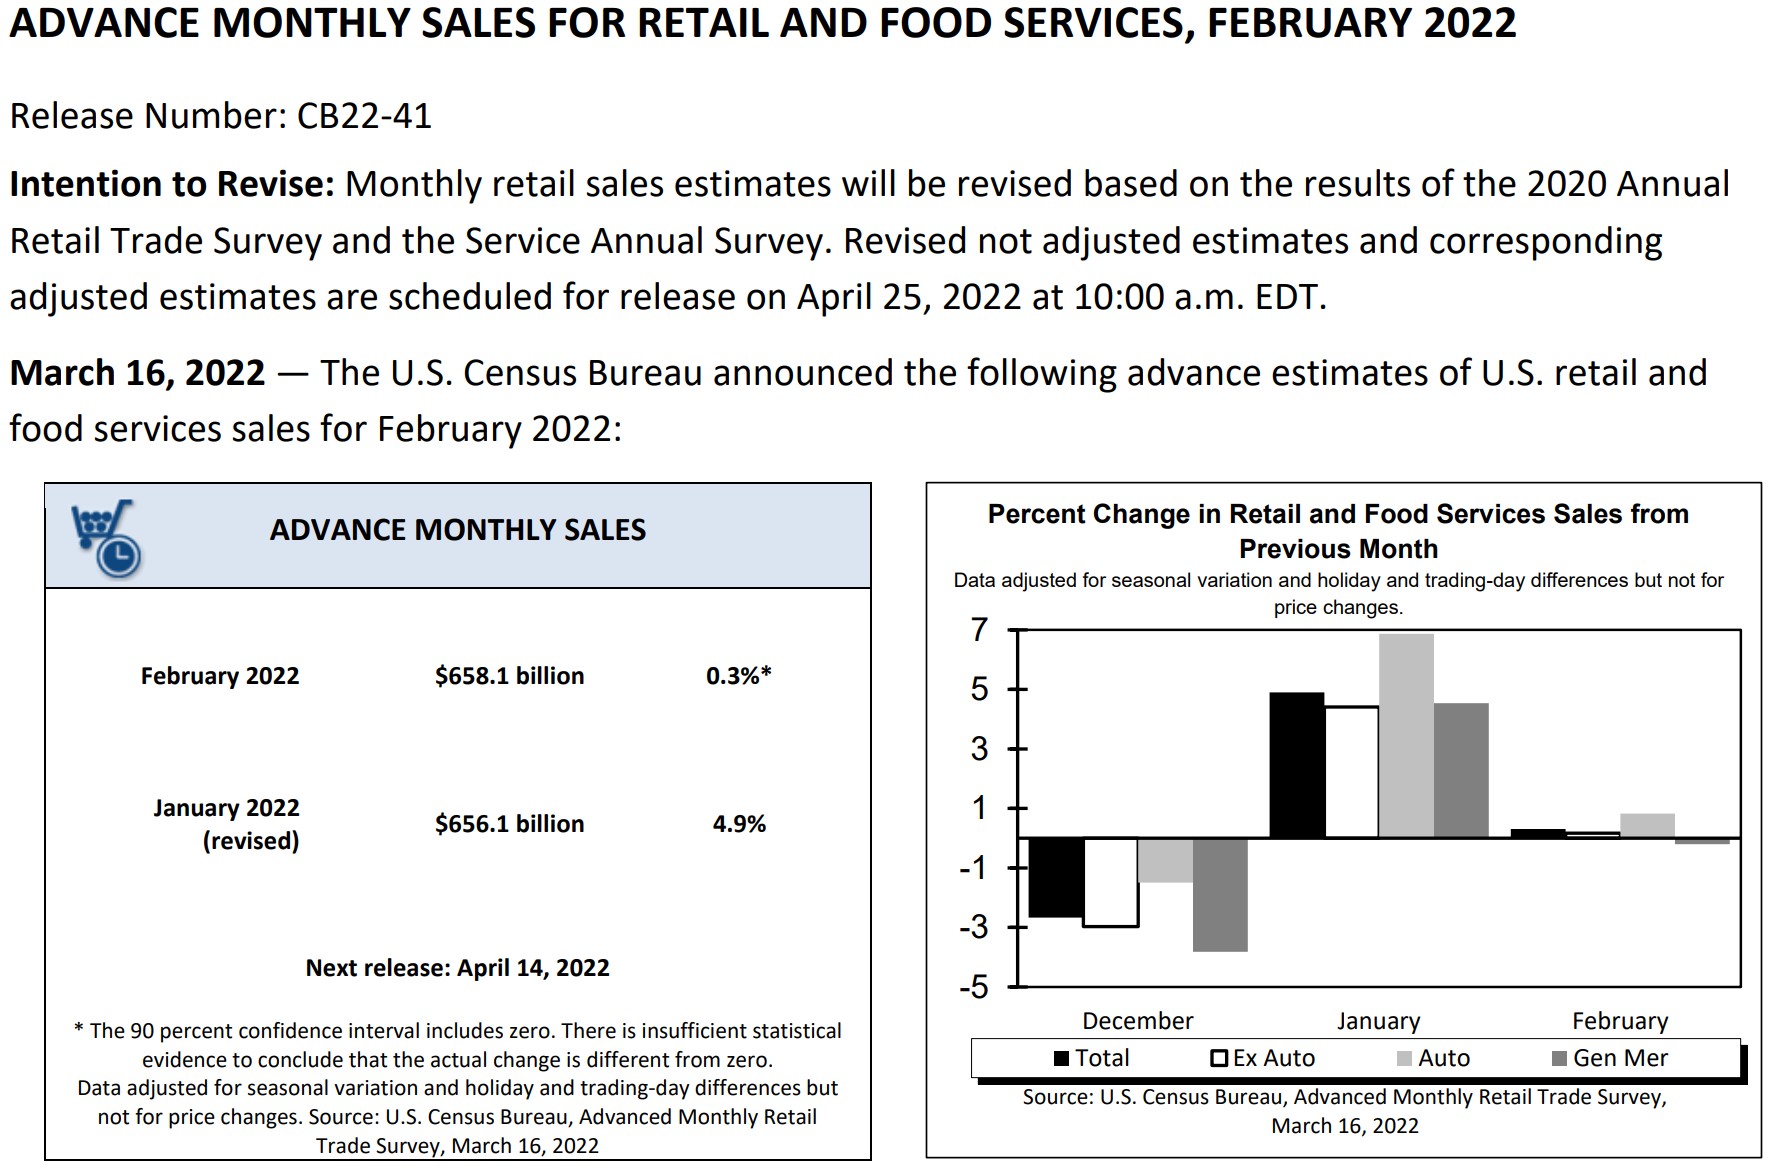
Seasonally adjusted retail sales increased 0.3% in February after retail sales for January were revised 1.0% higher . . . the Advance Retail Sales Report for February (above) from the Census Bureau estimated our seasonally adjusted retail and food services sales totaled $658.1 billion during the month, which was 0.3 percent (±0.5%)* higher than January’s revised sales of $656.1 billion, and 17.6 percent (±0.9 percent) above the adjusted sales in February of last year . . . January’s seasonally adjusted sales were revised up from $649.8 billion to $656.1 billion, while December’s sales were revised from $626.3 billion down to $625,459 million; as a result, the December to January change was revised up from up 3.8 percent (±0.5 percent) to up 4.9% (±0.3%) . . . the downward revision to December sales would indicate that 4th quarter personal consumption expenditures will be revised lower at about a $3.4 billion annual rate, which would reduce 4th quarter GDP by roughly 0.06 percentage points . . . estimated unadjusted sales, extrapolated from surveys of a small sampling of retailers, indicated sales were down 1.5%, from $586,401 million in January to $577,318 million in February, while they were up 17.7% from the $490,646 million of sales in February of a year ago..
Included below is the table of the monthly and yearly percentage changes in retail sales by business type taken from the February Census Marts pdf . . . the first pair of columns below gives us the seasonally adjusted percentage change in sales for each kind of business from the January revised figure to this month’s February “advance” report in the first sub-column, and then the year over year percentage sales change since last February is in the 2nd column . . . the second double column pair below gives us the revision of the January advance estimates (now called “preliminary”) as of this report, with the new December to January percentage change under “Dec 2021 (r)” (revised) and the January 2021 to January 2022 percentage change as revised in the last column shown . . . for your reference, our copy of the table of last month’s advance estimate of January sales, before this month’s revisions, is here, should you be interested in more detail in how January sales were revised nearly 1% higher.…

Producer Prices Rose 0.8% in January, Annual Increase at 10%, a Record High
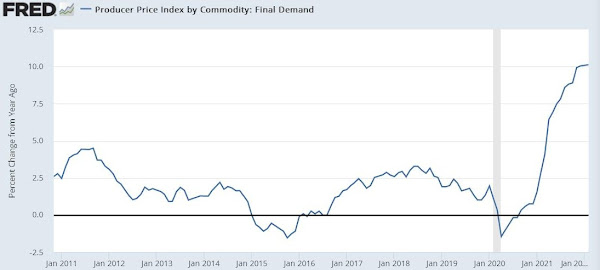
The seasonally adjusted Producer Price Index (PPI) for final demand rose 0.8% in February, as average prices for finished wholesale goods rose by a record 2.4% while final demand for services was unchanged . . . that increase followed a revised 1.2% PPI increase in January, when wholesale goods prices rose 1.5% and the price index of final demand for services rose 1.0%, a revised 0.4% increase in December, when average prices for finished wholesale goods fell 0.1%, but margins of final services providers were 0.7% higher, a revised 0.9% increase in November, when prices for finished wholesale goods rose 0.9% and margins of final services providers were 1.0% higher, and a revised 0.7% increase in October, when prices for finished wholesale goods rose 1.3% while margins of final services providers were 0.2% higher….on an unadjusted basis, producer prices are now a record 10.0% higher than a year ago, statistically matching the upwardly revised 10.0% year over year increase now shown for December’s producer prices, while the core producer price index, which excludes food, energy and trade services, rose by just 0.2% for the month, and is now 6.6% higher than in a year ago, down from the revised 6.8% year over year core PPI increase that is now indicated for January…
Below we are including a graph showing the year over year change in the PPI Final Demand price index, monthly over the period that metric has been computed; though statistically the same, February’s annual increase was 0.042% greater than January’s, and thus a record high…
As we noted, the price index for final demand for goods, previously called ‘finished goods’, was a record 2.4% higher in February, after being revised to 1.5% higher in January, after being 0.1% lower in December, 0.9% higher in November, 1.3% higher in October. 1.2% higher in September, 1.0% higher in August, 0.8% higher in July, 1.3% higher in June, 1.4% higher in May, 1.0% higher in April, 1.3% higher in March, and 1.4% higher in February of last year, and hence is now up by 14.37% from a year ago, albeit still down from November’s 14.85% record annual increase . . . the finished goods price index rose 2.4% in February as the price index for wholesale energy goods was 8.2% higher, after it had risen 3.7% in January, fallen 1.4% in December, risen by a revised 0.9% in November, and by a revised 5.0% in October, and as the price index for wholesale foods rose 1.9%, after rising 1.7% in January, falling by a revised 0.2% in December, while the index for final demand for core wholesale goods (excluding food and energy) rose 0.7% in February, after it had risen by a revised had risen 0.7% in January, by a revised 0.4% in December, by a revised 0.8% in November, and by a revised 0.7% in October . . . wholesale energy prices averaged 8.2% higher on a 14.4% increase in wholesale prices for gasoline, a 14.9% increase in wholesale prices for diesel fuel, a 14.8% increase in wholesale prices for home heating oil, and an 8.1% increase in wholesale prices for liquefied petroleum gas, while the wholesale food price index rose 1.9% on a 31.3% increase in wholesale prices for eggs for fresh use, a 4.5% increase in the wholesale price index for fresh fruits and melons, an 8.2% increase in the wholesale price index for shortening and cooking oils. a 9.2% increase in the wholesale price index for oilseeds, and a 9.1% increase in the wholesale price index for coffee, even as the wholesale price index for fresh and dry vegetables fell 9.4% . . . among core wholesale goods, the wholesale price index for household appliances rose 1.4%, the wholesale price index for industrial chemicals rose 1.5%, the wholesale price index for pumps, compressors, and related equipment rose 2.6%. the wholesale price index for agricultural machinery and equipment rose 2.0%, the wholesale price index for costume jewelry and novelties rose 4.4%, the wholesale price index for mobile homes rose 2.6%, the wholesale price index for sporting and athletic goods rose 3.7%, and the wholesale price index for truck trailers rose 6.2%….
At the same time, the index for final demand services was unchanged in February, after rising by a revised 1.0% in January, by a revised 0.7% in December. by a revised 0.9% in November, by a revised 0.2% in October, and by 0.1% in September, by 0.8% in August, and by 1.0% in July, and is now up by 7.8% from a year ago, albeit down from the record 8.2% year over year increase that is now indicated for December . . . the index for final demand for trade services rose 0.2%, and the index for final demand for transportation and warehousing services rose 1.9%, while the core index for final demand for services less trade, transportation, and warehousing services was 0.4% lower . . . among trade services, seasonally adjusted margins for furniture retailers rose 3.0%, margins for hardware, building materials, and supplies retailers rose 6.2%, margins for TV, video, and photographic equipment and supplies retailers rose 2.0%, margins for food and alcohol retailers rose 1.8%, and margins for paper and plastics products wholesalers rose 2.2%, while margins for automobile retailers fell 2.8%, margins for fuels and lubricants retailers fell 2.7%, and margins for apparel, jewelry, footwear, and accessories retailers fell 2.2% . . . among transportation and warehousing services, average margins for airline passenger services rose 3.0%, margins for truck transportation of freight rose 2.0%, and margins for air transportation of freight rose 0.5% . . . among the components of the core final demand for services index, the price index for portfolio management fell 4.2%, the price index for consumer loans fell 2.6%, the price index for passenger car rental fell 2.2%, the price index for traveler accommodation services fell 3.4%, and the price index for application software publishing fell 4.7%, while the price index for tax preparation and planning rose 1.8%, the price index for securities brokerage, dealing, investment advice, and related services rose 1.5% and the price index for residential property sales and leases, brokerage fees and commission rose 1.2% …
This report also showed the price index for intermediate processed goods rose 1.6% in February after rising a revised 2.0% in January, but after being unchanged in December, after rising a revised 1.5% in November, 2.4% in October, 1.2% in September, and 1.0% in August . . . the price index for intermediate energy goods rose 7.4% in January, as producer prices for liquefied petroleum gas rose 8.1%, producer prices for industrial natural gas rose 9.1%, refinery prices for gasoline rose 14.8%, refinery prices for jet fuel rose 14.5%, and refinery prices for diesel fuel rose 14.9% . . . at the same time, the price index for intermediate processed foods and feeds rose 1.9%, as the producer price index for processed poultry rose 3.2%, the producer price index for dairy products rose 2.9%, the producer price index for prepared animal feeds rose 2.8%, and the producer price index for fats and oils rose 6.0% . . .meanwhile, the core price index for intermediate processed goods less food and energy goods rose 0.1%, as the producer price index for softwood lumber rose 2.6%, the producer price index for plywood rose 5.5%, the producer price index for switchgear, switchboard, and industrial controls equipment rose 3.3%, the producer price index for aluminum mill shapes rose 6.2%, the producer price index for metal containers rose 2.6%, the producer price index for motors, generators, motor generator sets rose 2.9%, the producer price index for primary nonferrous metals rose 5.4%, the producer price index for secondary nonferrous metals rose 3.4%, the producer price index for paint materials rose 3.3%, the producer price index for adhesives and sealants rose 3.6%, and the producer price index for nitrogenates rose 5.5%, while the producer price index for plastic resins and materials fell 3.1% and the producer price index for steel mil products fell 9.9% …average prices for intermediate processed goods are now 23.3% higher than in February a year ago, down from their 24.6% year over year increase in January, and down from.their 26.6% year over year increase in November, which had been a 46 year high…..
Meanwhile, the price index for intermediate unprocessed goods rose 14.6% in February after rising a revised 0.1% in January, after falling by a revised 4.9% in December, rising by a revised 2.3% in November. rising by a revised 6.0% in October, and by 2.8% in September, 1.4% in August, and by 3.2% in July, by 2.1% in June, and by 7.9% in May . . . that was as the January price index for crude energy goods rose 32.2% as unprocessed natural gas prices rose 65.1%, crude oil prices rose 13.7% and coal prices rose 3.0%…at the same time, the price index for unprocessed foodstuffs and feedstuffs was 3.0% higher on a 30.7% increase in producer prices for slaughter hogs, a 3.3% increase in producer prices for slaughter cattle, a 8.7% increase in producer prices for alfalfa hay, and a 9.2% increase in producer prices for oilseeds . . . meanwhile, the index for core raw materials other than food and energy materials was 1.4% higher, as a 4.7% increase in the price index for raw cotton, a 4.3% increase in the price index for hides and skins and a 1.6% increase in the price index for construction sand, gravel, and crushed stone were partly offset by a 1.4% decrease in the price index for iron and steel scrap and a 1.0% decrease in the price index for nonferrous metal ores . . . this raw materials index now 35.1% higher than a year ago, up from the 32.3% year over year increase in January, but down from the record 59.2% annual increase in April, and now the sixteenth consecutive year over year increase for this index after the annual change on this index had been negative from the beginning of 2019 through October of 2020…
Lastly, the price index for intermediate services was unchanged in February, after rising a revised 0.7% in January, by 0.6% in December, by 0.8% in November, after being unchanged in October, after rising by a revised 0.3% in September, by 0.4% in August, and rising by 0.6% in July and by 1.2% in June . . . the price index for intermediate trade services was rose 0.8%, as margins for intermediate hardware, building materials, and supplies retailers rose 6.3%, margins for intermediate paper and plastics products wholesalers rose 2.2%, margins for intermediate food wholesalers rose 1.1% and margins for intermediate machinery and equipment parts and supplies wholesalers rose 0.9% . . . at the same time, the index for transportation and warehousing services for intermediate demand was 0.6% higher, as the intermediate price index for transportation of passengers rose 3.0%, the intermediate price index for air mail and package delivery services, (not by USPS) rose 2.4%, the intermediate price index for arrangement of freight and cargo rose 2.9%, the intermediate price index for truck transportation of freight rose 2.0%, and the intermediate price index for water transportation of freight rose 1.8%, while the intermediate price index for warehousing, storage, and related services fell 3.4% and the intermediate price index for the U.S. Postal Service fell 1.9% . . . on the other hand the core price index for intermediate services other than trade, transportation, and warehousing services fell 0.4%, as the intermediate price index for television advertising time sales fell 3.3%, the intermediate price index for advertising space sales in periodicals and newspapers fell 2.7%, the intermediate price index for business loans (partial) fell 2.9%%, the intermediate price index for portfolio management fell 4.2%. the intermediate price index for nonresidential real estate rents fell 2.8%, and the intermediate price index for traveler accommodation services fell 3.4%, while the intermediate price index for radio advertising time sales rose 10.0%…over the 12 months ended in January, the year over year price index for services for intermediate demand is still 7.4% higher than it was a year ago, the seventeenth consecutive positive annual increase in this index change since it briefly turned negative year over year from April to August of 2020, while it is still down from the record 9.5% year over year increase indicated for July…