RJS, MarketWatch 666; January’s construction spending As usual, I estimate the impact of revisions to prior months on 4th quarter GDP, and the impact of the January report on 1st quarter GDP… Construction Spending Up 1.3% on Higher Costs in January after December and November Spending Was Revised Higher The Census Bureau’s report on January construction spending (pdf) estimated January’s seasonally adjusted construction spending would work out to ,677.2 billion annually if extrapolated over an entire year, which was 1.3 percent (±0.8 percent) above the revised annualized estimate of ,655.8 billion for construction spending in December, and 8.2 percent (±1.2 percent) above the estimated annualized level of construction spending of
Topics:
Angry Bear considers the following as important: Hot Topics, US EConomics
This could be interesting, too:
NewDealdemocrat writes JOLTS revisions from Yesterday’s Report
Joel Eissenberg writes No Invading Allies Act
Bill Haskell writes The North American Automobile Industry Waits for Trump and the Gov. to Act
Bill Haskell writes Families Struggle Paying for Child Care While Working
RJS, MarketWatch 666; January’s construction spending
As usual, I estimate the impact of revisions to prior months on 4th quarter GDP, and the impact of the January report on 1st quarter GDP…
Construction Spending Up 1.3% on Higher Costs in January after December and November Spending Was Revised Higher
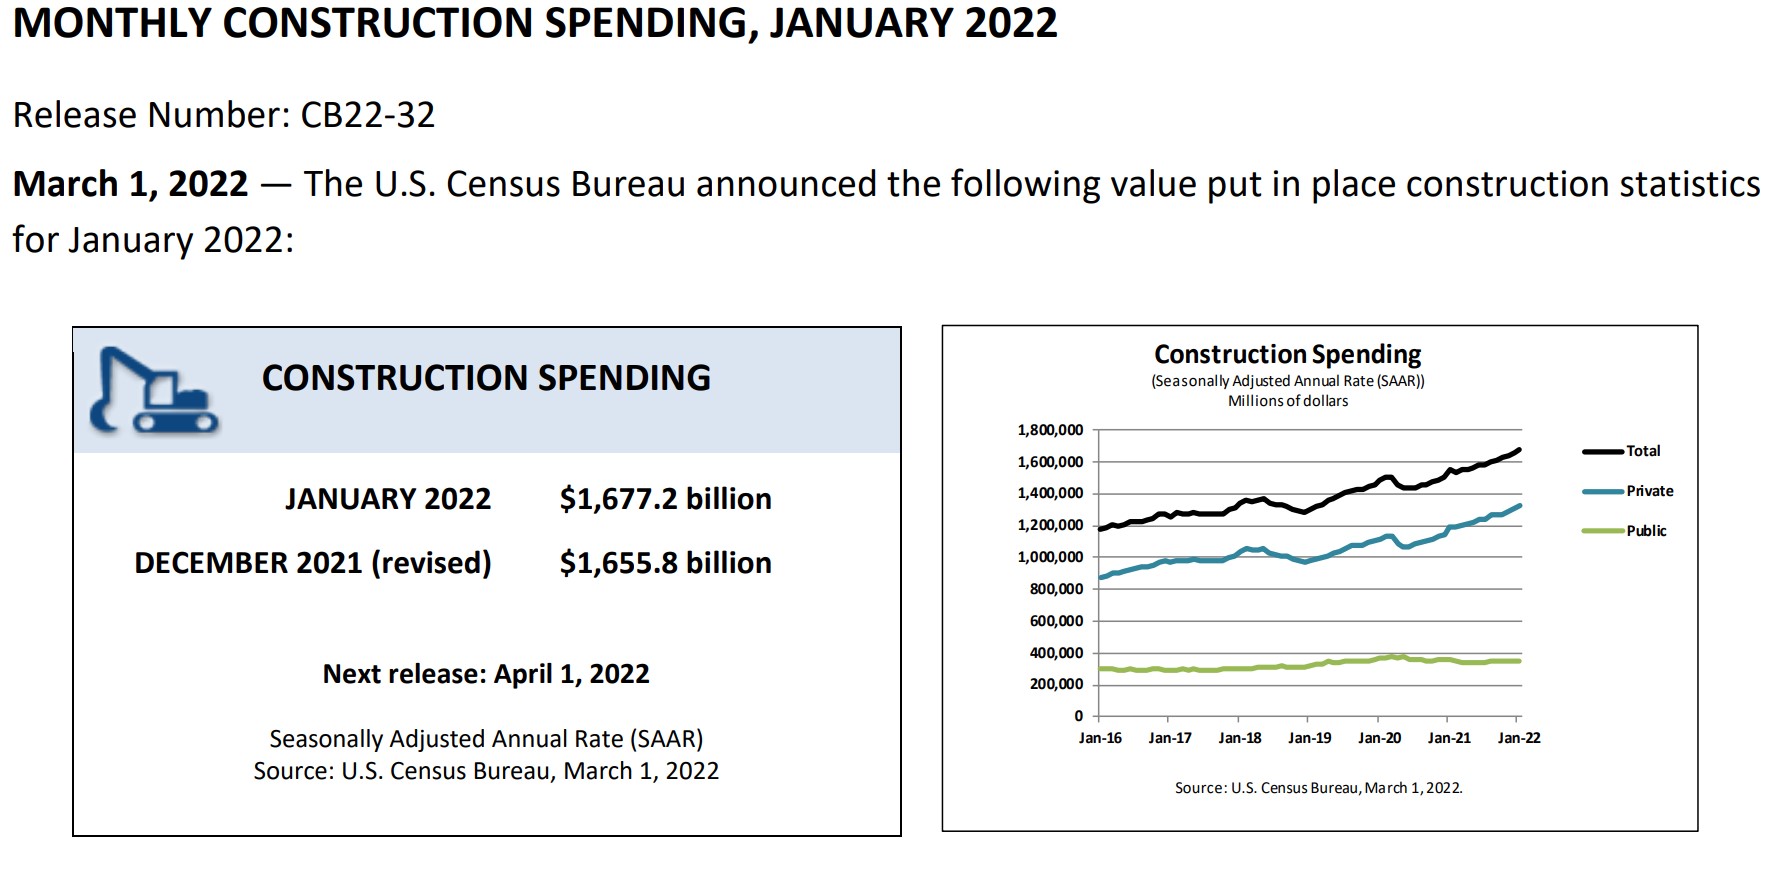
The Census Bureau’s report on January construction spending (pdf) estimated January’s seasonally adjusted construction spending would work out to $1,677.2 billion annually if extrapolated over an entire year, which was 1.3 percent (±0.8 percent) above the revised annualized estimate of $1,655.8 billion for construction spending in December, and 8.2 percent (±1.2 percent) above the estimated annualized level of construction spending of January last year . . . the December spending estimate was revised from the $1,639.9 billion figure published a month ago to $1,655.8 billion, while November’s annualized construction spending was revised from $1,636.5 billion to $1,643,024 billion . . . since those figures are already annualized, the combined upward revisions of $22.4 billion to November and December construction spending figures would be averaged over the 3 months of the 4th quarter and therefore raise the quarter’s annualized construction spending by almost $7.5 billion, and would thus imply an upward revision of about 0.15 percentage points to fourth quarter GDP when the third estimate is released at the end of March, assuming there are no major changes to or imbalances in the previously applied inflation adjustments…
A further breakdown of the different subsets of construction spending is provided in a Census summary, which precedes their detailed spreadsheets:
- Private Construction: Spending on private construction was at a seasonally adjusted annual rate of $1,326.5 billion, 1.5 percent (±0.5 percent) above the revised December estimate of $1,307.1 billion. Residential construction was at a seasonally adjusted annual rate of $829.4 billion in January, 1.3 percent (±1.3 percent)* above the revised December estimate of $819.0 billion. Nonresidential construction was at a seasonally adjusted annual rate of $497.2 billion in January, 1.8 percent (±0.5 percent) above the revised December estimate of $488.2 billion.
- Public Construction: In January, the estimated seasonally adjusted annual rate of public construction spending was $350.7 billion, 0.6 percent (±1.5 percent)* above the revised December estimate of $348.7 billion. Educational construction was at a seasonally adjusted annual rate of $80.9 billion, virtually unchanged from (±1.8 percent)* the revised December estimate of $81.0 billion. Highway construction was at a seasonally adjusted annual rate of $105.3 billion, 0.1 percent (±4.1 percent)* below the revised December estimate of $105.5 billion.
As you can tell from the summary, construction spending would input into 3 subcomponents of GDP; investment in private non-residential structures, investment in residential structures, and into government investment outlays, for both state and local and Federal governments . . . however, getting an accurate read on the impact of January’s construction spending reported in this release on 1st quarter GDP is difficult because all figures given here are in nominal dollars and as you know, data used to compute the change in GDP must be adjusted for changes in price . . . moreover, there are multiple price indexes for different types of construction listed in the National Income and Product Accounts Handbook, Chapter 6 (pdf), so in lieu of trying to adjust for all of those types of construction separately, we’ve opted to just use the producer price index for final demand construction as an inexact shortcut to make the needed price adjustment and come up with an estimate . . . that index showed that aggregate construction costs were up 3.9% in January, after they had risen by 0.3% in December and by 0.4% in November…
On that basis, we can thus estimate that January construction costs were roughly 4.2% more than those of November, and about 4.6% more than October, and of course, 3.9% more than December . . . we’ll then use those percent increases to inflate the lower priced spending figures for each of the 4th quarter months and compare them to January, which is arithmetically the same as deflating January construction spending, for purposes of comparison . . . this report gives annualized construction spending in millions of dollars for the 4th quarter months as $1,655,847 in December, $1,643,024 in November, and $1,626,413 in October . . . thus to compare January’s annualized construction spending of $1,677,246 million to ‘inflation adjusted’ figures of the fourth quarter, our calculation is: (1,677,246 / ((( 1,655,847 * 1.039) + (1,643,024 * 1.042) + (1,626,413 *1.046)) / 3) = 0.980142, hence indicating that adjusted for inflation, construction spending in January was down 1.99% vis a vis that of the 4th quarter, or down at a 7.71% annual rate . . . then, to figure the potential effect of that estimated change on GDP, we take the difference between the 4th quarter inflation adjusted average and January’s inflation adjusted spending as a fraction of inflation adjusted 4th quarter GDP, and find that January construction spending is falling at a rate that would subtract about 0.67 percentage points from 1st quarter GDP, if in the unlikely event that there is no further change in real construction over the next two months..