RJS, MarketWatch 666 Summary: Retail Sales Rose 0.9% in April after March Sales Revised 0.9% Higher Seasonally adjusted retail sales rose 0.9% in April, after retail sales March were revised 0.9% higher, while sales for February were revised a bit lower . . . the Advance Retail Sales Report for April (pdf) from the Census Bureau estimated that our seasonally adjusted retail and food services sales totaled a record high 7.7 billion during the month, which was up by 0.9 percent (±0.5 percent) from revised March sales of 1.6 billion, and 8.2 percent (± 0.7 percent) above the adjusted sales of April of last year . . . March sales were originally reported at 5.7 billion, up 0.5% from February; they are now indicated to have risen
Topics:
Angry Bear considers the following as important: MarketWatch 666, Retail sales, RJS, US EConomics
This could be interesting, too:
NewDealdemocrat writes JOLTS revisions from Yesterday’s Report
Bill Haskell writes The North American Automobile Industry Waits for Trump and the Gov. to Act
Bill Haskell writes Families Struggle Paying for Child Care While Working
Joel Eissenberg writes Time for Senate Dems to stand up against Trump/Musk
RJS, MarketWatch 666
Summary: Retail Sales Rose 0.9% in April after March Sales Revised 0.9% Higher
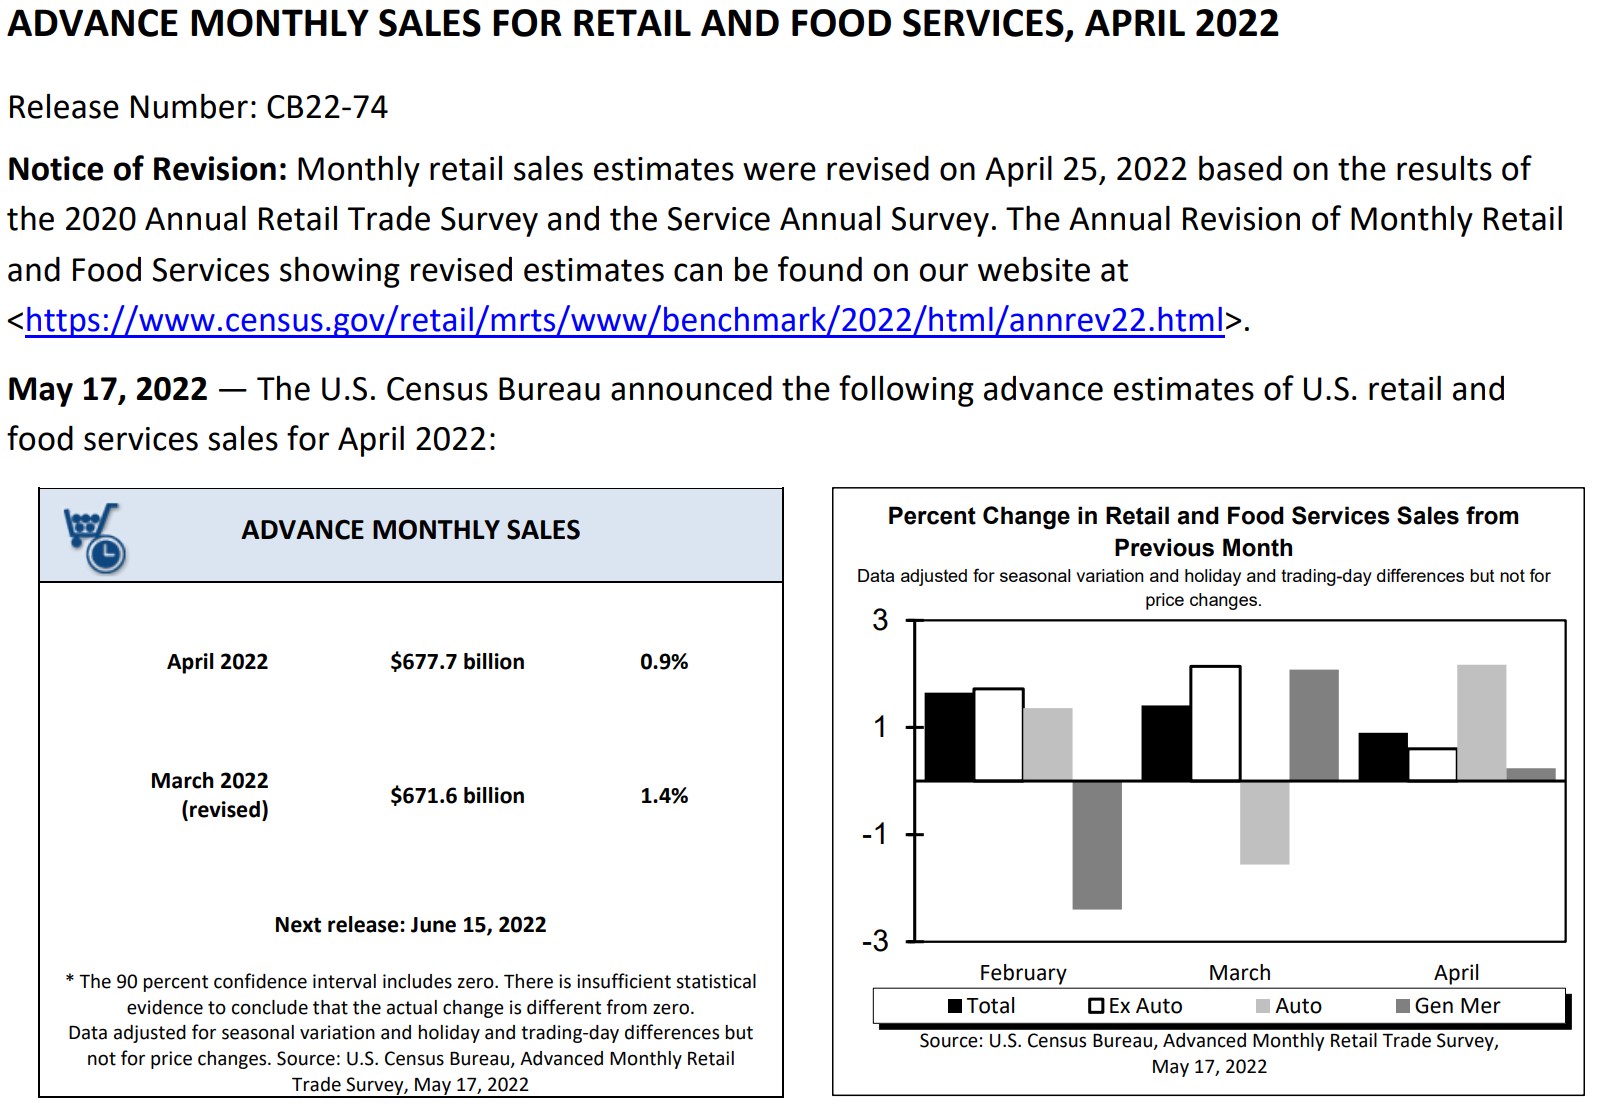
Seasonally adjusted retail sales rose 0.9% in April, after retail sales March were revised 0.9% higher, while sales for February were revised a bit lower . . . the Advance Retail Sales Report for April (pdf) from the Census Bureau estimated that our seasonally adjusted retail and food services sales totaled a record high $677.7 billion during the month, which was up by 0.9 percent (±0.5 percent) from revised March sales of $671.6 billion, and 8.2 percent (± 0.7 percent) above the adjusted sales of April of last year . . . March sales were originally reported at $665.7 billion, up 0.5% from February; they are now indicated to have risen 1.4% to $671.6 billion, while February adjusted sales were concurrently revised from $662.4 billion to $662.3 billion…the net of those revisions to February and March sales would increase first quarter sales at about a $23.4 billion annual rate and add about 0.38 percentage points, give or take, to 1st quarter GDP when the 2nd estimate is released at the end of this month…estimated unadjusted sales, extrapolated from surveys of a small sampling of retailers, indicated nominal dollar sales rose 0.4%, from $681,430 million in March to $684,195 million in April, while they were up 8.7% from the $629,451 million of sales in April a year ago….
We are again including below the table of monthly and yearly percentage changes in sales by business type, taken from the Census marts pdf . . . the first double column below gives us the seasonally adjusted percentage change in sales for each type of retail business type from March to April in the first column, and then the year over year percentage change for those businesses since last April in the 2nd column; the second pair of columns gives us the revision of last month’s March advance monthly estimates (now called “preliminary”) as revised in this report, likewise for each business type, with the February to March change under “Feb 2022 r (revised)” and the revised March 2021 to March 2022 percentage change in the last column shown . . . for your reference, our copy of the table of last month’s advance March estimates, before this report’s revision, is here….

To compute April’s real personal consumption of goods data for national accounts from this April retail sales report, the BEA will use the corresponding price changes from the April consumer price index, which we reviewed last week . . . to estimate what they will find, we’ll first separate out the volatile sales of gasoline from the other totals . . . from the third line on the above table, we can see that March retail sales excluding the 2.7% price-related decrease in sales at gas stations were up by 1.3% . . . then, by subtracting the amounts representing the 0.2% decrease in grocery & beverage sales and the 2.0% increase in food services sales out from that total, we find that core retail sales were up by roughly 1.4% for the month . . . since the April CPI report showed that the composite price index of all goods less food and energy goods was 0.2% higher in April, we can thus figure that real retail sales excluding food and energy will show an increase of roughly 1.2% . . . however, the actual adjustment in national accounts for each of the types of sales shown above will vary by the change in the related price index . . . for instance, while nominal sales at motor vehicle & parts dealers were up 2.2%, the April price index for transportation commodities other than fuel was 0.4% higher, which would suggest that real unit sales at auto & parts dealers were likey on the order of 1.8% higher, once price increases are taken into account . . . on the other hand, while nominal sales at clothing stores were 0.8% higher in April, the apparel price index was 0.8% lower, which means that real sales of clothing likely rose around 1.6%…
In addition to figuring those core real retail sales, to make an estimate of the change in real sales, we’ll need to adjust food and energy retail sales for their price changes separately, just as the BEA will do . . . the April CPI report showed that the food price index was 0.9% higher, as the price index for food purchased for use at home rose 1.0% while the index for food bought away from home was 0.6% higher . . . thus, while nominal sales at food and beverage stores were 0.2% lower, real sales of food and beverages would have 1.2% lower in light of the 1.0% higher prices . . . similarly, the 2.0% increase in nominal sales at bars and restaurants, once adjusted for 0.6% higher prices, suggests that real sales at bars and restaurants rose by around 1.4% during the month…and while sales at gas stations were down 2.7%, there was a 6.1% decrease in price of gasoline during the month, which would suggest that real sales of gasoline were actually up on the order of 3.6%, with a caveat that gasoline stations do sell more than gasoline, products which should not be adjusted with gasoline prices, so the actual increase in real sales at gas stations was likely smaller . . . reweighing and averaging the real sales changes that we have thus estimated back together, and excluding food services, we can then estimate that the income and outlays report for April will show that real personal consumption of goods rose by around 1.2% in April, after rising by a revised 0.4% in March, but after falling by a revised 0.9% in February and rising by 3.1% in January . . . at the same time, the 1.4% increase in real sales at bars and restaurants should add about 0.1% to April’s real personal consumption of services…
* * * * *
Business Sales Rose 1.8% in March, Business Inventories Were Up 2.0%
After the release of the April retail sales report, the Census Bureau also released the composite Manufacturing and Trade, Inventories and Sales report for March (pdf), which incorporates the revised March retail data from that April retail report and the earlier published March wholesale and factory data to give us a complete picture of the business impact on the economy for that month.
Note that retail sales and inventories were revised on April 25th, which thus revised the figures that were reported a month ago, even before the usual revisions to the prior month’s data that accompany this report…
According to the Census Bureau, total manufacturers’ and trade sales were estimated to be valued at a seasonally adjusted $1,832.1 billion in March, up 1.8 percent (±0.2 percent) from February’s revised sales, and up 14.1 percent (±0.4 percent) from March sales of last year . . . at the same time, total February sales were revised down from the originally reported $1,804.6 billion to $1,800.4 million, but are now a 1.2% increase from January . . . manufacturer’s sales rose 2.3% to $556,354 million in March; retail trade sales, which exclude restaurant & bar sales from the revised March retail sales reported earlier, rose 1.3% to $589,550 million, while wholesale sales rose 1.7% to $686,150 million..
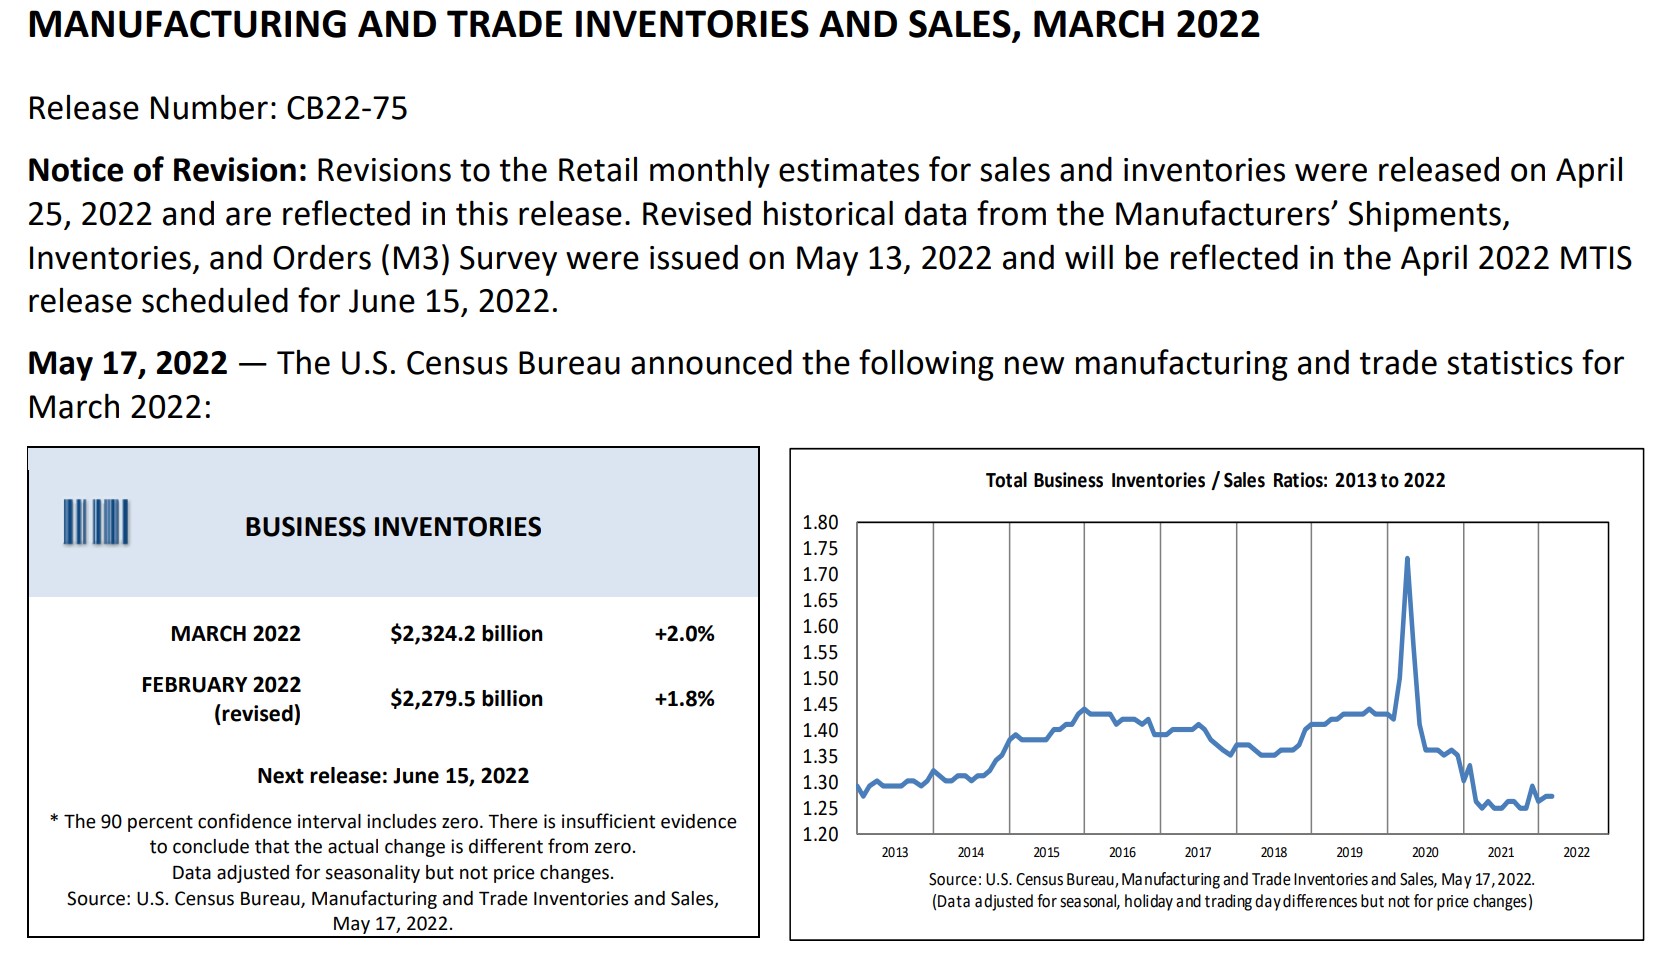
Meanwhile, total manufacturer’s and trade inventories, a major component of GDP, were estimated to be valued at a seasonally adjusted $2,324.2 billion at the end of March, up 2.0% (±0.1%) from the end of February, and up 14.7 percent (±0.5 percent) from inventories of March a year earlier . . . the value of end of February inventories was revised from the $2,270.3 billion reported last month to $2,279.547 billion, which is now 1.8% more than January’s inventory valuation . . . seasonally adjusted inventories of manufacturers were estimated to be valued at $797,563 million, up 1.3% from February, while inventories of retailers were valued at $686,364 million, 2.3% more than those of February, and while inventories of wholesalers were estimated to be valued at $840,321 million at the end of March, also 2.3% more than in February…
Two weeks ago we figured that there would be a 0.01 percentage point upward revision to first quarter GDP based on the inventory change the factory report showed, while last week we figured that 1st quarter GDP was underestimated by around 0.11 percentage points based on what the wholesale inventories report showed . . . the BEA’s Key source data and assumptions (xls) that accompanied the release of the advance estimate of 1st quarter GDP indicates that they had estimated that the value of retail inventories March would increase by $14.4 billion before adjustment with the PPI, which is less than the $15.1 billion that this report indicates…that $0.7 billion underestimation would result in another 0.02 percentage point upward revision to first quarter GDP . . . combining those 3 inventory revisions, this report thus indicates there should be a net upward adjustment of around 0.14 percentage points to 1st quarter GDP when the 2nd estimate is released at the end of May…