Consumers still spend, but real income declines, leaving them increasingly vulnerable to price shocks Nominal personal income was unchanged in January, while spending rose 2.1%. In real terms after inflation, personal income declined -0.5%, and personal consumption expenditures rose 1.5%, completely reversing December’s decline, and adding about 0.2%. I have stopped comparing them with their pre-pandemic levels (they are both well above that). Rather, the more important comparison now is with their level after last winter’s round of stimuli. Accordingly, the below graph is normed to 100 as of May 2021: Since then spending is up 2.2%, while income has declined -1.4%. Comparing real personal consumption expenditures with real retail
Topics:
NewDealdemocrat considers the following as important: consumer spending, real income, Taxes/regulation, US EConomics, US/Global Economics
This could be interesting, too:
NewDealdemocrat writes JOLTS revisions from Yesterday’s Report
Bill Haskell writes The North American Automobile Industry Waits for Trump and the Gov. to Act
Bill Haskell writes Families Struggle Paying for Child Care While Working
Joel Eissenberg writes Time for Senate Dems to stand up against Trump/Musk
Consumers still spend, but real income declines, leaving them increasingly vulnerable to price shocks
Nominal personal income was unchanged in January, while spending rose 2.1%. In real terms after inflation, personal income declined -0.5%, and personal consumption expenditures rose 1.5%, completely reversing December’s decline, and adding about 0.2%. I have stopped comparing them with their pre-pandemic levels (they are both well above that). Rather, the more important comparison now is with their level after last winter’s round of stimuli. Accordingly, the below graph is normed to 100 as of May 2021:

Since then spending is up 2.2%, while income has declined -1.4%.
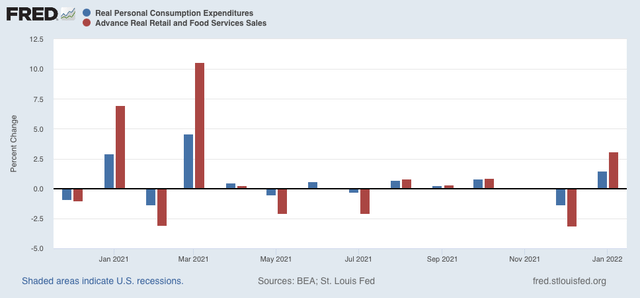
Comparing real personal consumption expenditures with real retail sales for January (essentially, both sides of the consumption coin) reveals both rebounded almost exactly from their respective December declines:

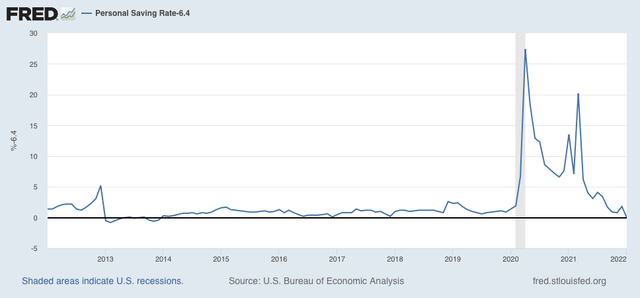
Many people front-loaded their Christmas spending into October, so the decline in November and December was not too concerning. On the other hand, the continued decline in income since last spring is somewhat. In that regard, the personal saving rate was 6.4% in January. The below graph shows that past 10 years, from which I’ve subtracted 6.4%, so that it shows at exactly the 0 level:

The saving rate is now below any point since the end of 2013. This means that consumers are more vulnerable to a price “shock” than at any time in the last 8 years (house, car, and gas prices, anyone?). One of my recession models – the “consumer nowcast” – is based on such a shock that is unable to be made up from increased real income, or an increased source of wealth to be cashed in. If income has faltered, and if stocks are – perhaps – faltering, that leaves housing wealth, which is still increasing sharply but is itself increasingly vulnerable as well, as I laid out earlier this week.
