Coronavirus dashboard for May 20: signs of a peak in BA.2.12.1 in bellwether jurisdictions; is BA.4/BA.5 next? With no significant economic data today, let’s take a look at where the BA.2.12.1 COVID wave is. Nationwide cases (thin line below) have increased about 3.5x from their bottom of roughly 26,700 five weeks ago, to just over 100,000. Meanwhile, deaths (thick line) appear to still be in the process of making a bottom at under 300 per day: A longer term perspective shows that, compared with the Omicron peak, both deaths and cases are comparatively very low: The CDC variant update shows that, as of last week, the BA.2.12.1 variant was causing just under 50% of cases nationwide. Its share has been increasing by only about 6%-7% per
Topics:
NewDealdemocrat considers the following as important: coronavirus dashboard, Coronavirus: regional variations, Healthcare
This could be interesting, too:
Bill Haskell writes Families Struggle Paying for Child Care While Working
Joel Eissenberg writes RFK Jr. blames the victims
Joel Eissenberg writes The branding of Medicaid
Bill Haskell writes Why Healthcare Costs So Much . . .
Coronavirus dashboard for May 20: signs of a peak in BA.2.12.1 in bellwether jurisdictions; is BA.4/BA.5 next?
With no significant economic data today, let’s take a look at where the BA.2.12.1 COVID wave is.
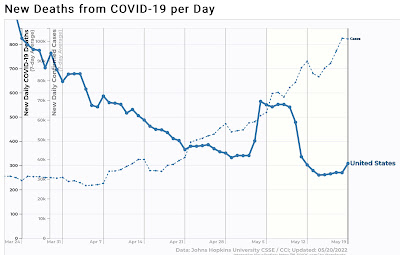
Nationwide cases (thin line below) have increased about 3.5x from their bottom of roughly 26,700 five weeks ago, to just over 100,000. Meanwhile, deaths (thick line) appear to still be in the process of making a bottom at under 300 per day:
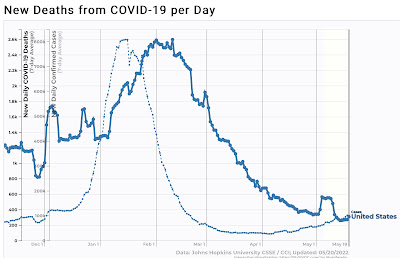
A longer term perspective shows that, compared with the Omicron peak, both deaths and cases are comparatively very low:
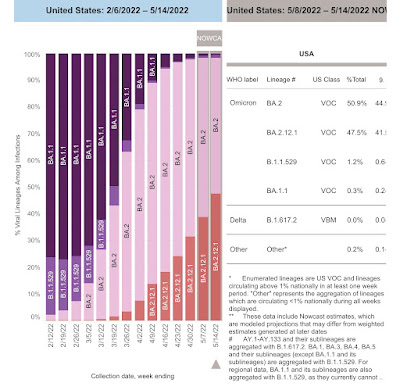
The CDC variant update shows that, as of last week, the BA.2.12.1 variant was causing just under 50% of cases nationwide. Its share has been increasing by only about 6%-7% per week nationwide in the past month:
As usual, different regions of the country show very different progress of the BA.2.12.1 variant:
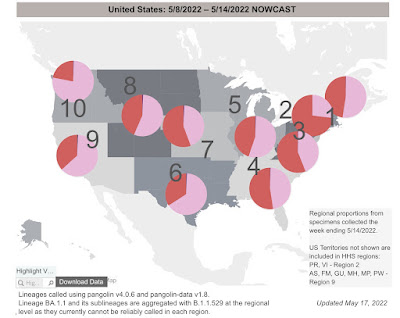
NY, NJ, and PR remain the epicenter, with BA.2.12.1 constituting a majority of cases along the rest of the East Coast and, surprisingly, in the central Plains. Meanwhile, it constitutes a distinct minority of cases along the West Coast.
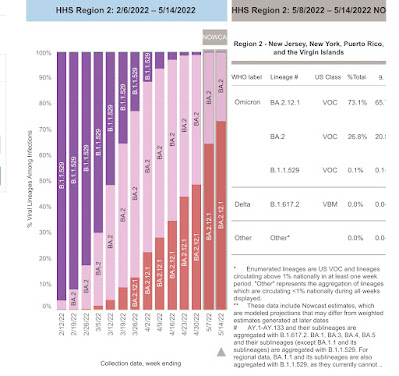
Focusing on the bellwether region, in NY, NJ, and PR, BA.2.12.1 made up almost 75% of cases last week:
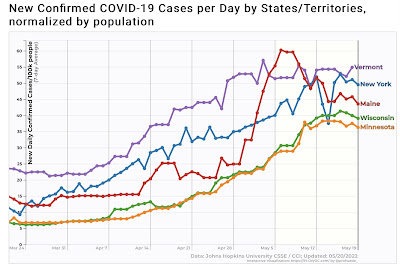
And this week showed the first signs that BA.2.12.1 cases are peaking in the Northeast and portions of the upper Midwest that also began to rise early this spring:
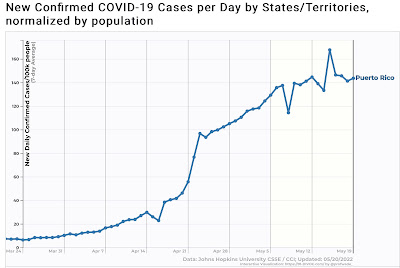
Puerto Rico has been particularly hard hit, so I am showing it separately. It too is apparently peaking:
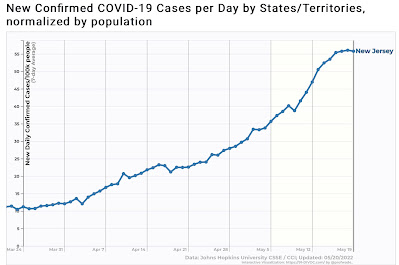
New Jersey has still been rising, with a possible peak beginning to form in the past few days:
With the exception of PR, where cases increased 30x, and Vermont, where cases only increased roughly 2.5x, the other bellwether States increased roughly 5x from their March bottoms to their present peaks.
If we extrapolate the experience of the bellwether jurisdictions to the rest of the country, we can expect cases to continue to rise for about another month, with a peak of about 140,000 -150,000 cases. A similar increase in deaths would put a peak of roughly 1400-1600/day in about 2 months.
With ever more evidence that reinfections are becoming common, plus plenty of evidence that the Omicron variants can break through vaccinations (although it must be emphasized that cases in vaccinated people are typically much milder, with much less risk of poor outcomes), we meanwhile await the inevitable next variant, which may or may not be the BA.4 and BA.5 lineages from South Africa, which are now being found in almost every State albeit in very small amounts.
