Coronavirus dashboard for April 27: Estimating the BA.2.12.1 wave The CDC updated its variant proportions data yesterday. BA.2.12.1 cases grew from 19% to 29% of all US cases: and from 45% to 60% in NY and NJ. At the other end of the spectrum, BA.2.12.1 was only 9% of cases in the Pacific Northwest and 8% in the South Central region. BA.1 is down to only 2% of cases: Focusing on NY and NJ, NJ has had a little spurt in the last couple of days, probably just due to an artifact of daily reporting one week ago, and is now up 15% for the week. Deleting that artifact, NJ is only up 4% for the week. NY appears to be peaking right now, 6.5 weeks after its recent lows, with cases essentially flat for the last 6 days, and up only 7%
Topics:
NewDealdemocrat considers the following as important: coronavirus dashboard, Healthcare
This could be interesting, too:
Bill Haskell writes Families Struggle Paying for Child Care While Working
Joel Eissenberg writes RFK Jr. blames the victims
Joel Eissenberg writes The branding of Medicaid
Bill Haskell writes Why Healthcare Costs So Much . . .
Coronavirus dashboard for April 27: Estimating the BA.2.12.1 wave
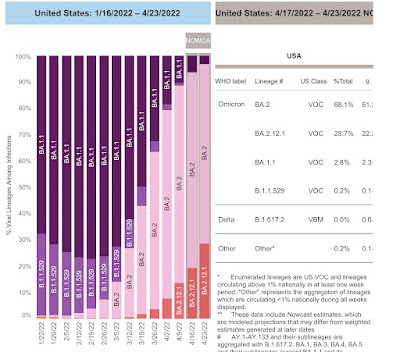
The CDC updated its variant proportions data yesterday. BA.2.12.1 cases grew from 19% to 29% of all US cases:
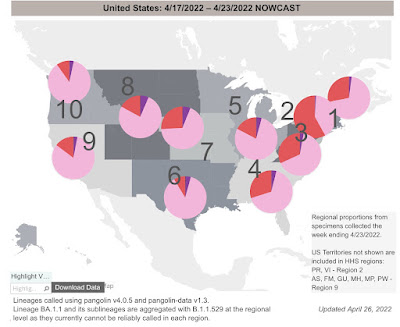
and from 45% to 60% in NY and NJ. At the other end of the spectrum, BA.2.12.1 was only 9% of cases in the Pacific Northwest and 8% in the South Central region. BA.1 is down to only 2% of cases:
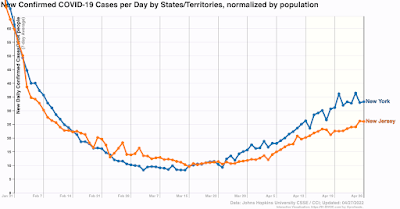
Focusing on NY and NJ, NJ has had a little spurt in the last couple of days, probably just due to an artifact of daily reporting one week ago, and is now up 15% for the week. Deleting that artifact, NJ is only up 4% for the week. NY appears to be peaking right now, 6.5 weeks after its recent lows, with cases essentially flat for the last 6 days, and up only 7% for the week. Cases tripled during that period:
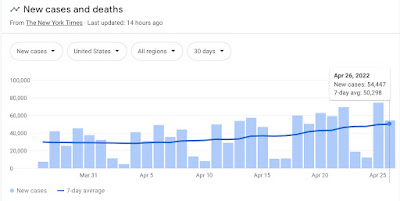
For the US as a whole, as of yesterday cases rose to 50,300, and are up over 20% in the last week:
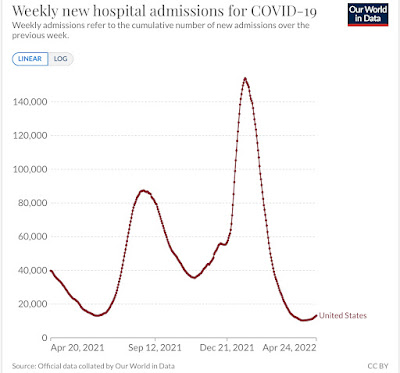
Hospital admissions rose 400 to 13,167, an increase of almost 20% in the last week, but still a very low historical number:
Deaths declined to a new low of 338. Deaths were only lower in late June and July of last year:
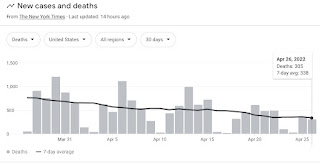
Applying the template from NY to the US as a whole, I suspect we will see a US peak from BA.2.12.1 by about Memorial Day at 75,000-90,000 cases and 25,000-30,000 hospitalizations. Because deaths have not bottomed yet, where they will peak in this wave is much more uncertain, but as of now, they seem likely to peak a little under 1000 by mid-year.
The CDC also published an Important study of seroprevalence through February. I’ve cleaned up the text somewhat, and omitted the 2%-3% confidence interval noted for each subgroup.
“During December 2021–February 2022, overall U.S. seroprevalence increased
- From 33.5% to 57.7%.
- from 44.2% to 75.2% among children aged 0–11 years
- from 45.6% to 74.2% among persons aged 12–17 years.
- from 36.5% to 63.7% among adults aged 18–49 years
- from 28.8% to 49.8% among those aged 50–64 years
- from 19.1% to 33.2% among those aged ≥65 years.
“[In summary, a]s of February 2022, approximately 75% of children and adolescents had serologic evidence of previous infection with SARS-CoV-2, with approximately one third becoming newly seropositive since December 2021. The greatest increases in seroprevalence during September 2021–February 2022, occurred in the age groups with the lowest vaccination coverage ….”According to the CDC, 66%, or 196M of 258M adults have had at least 2 shots, and 50M, or 90% of seniors have. But only 43% of eligible children (ages 5-17) have had 2 shots.
The CDC noted that these findings are subject to some limitations, most importantly that “all samples were obtained for clinical testing might overrepresent persons with greater health care access or who more frequently seek care,” and “these findings might underestimate the cumulative number of SARS-CoV-2 infections because [testing for] seroprevalence cannot account for reinfections.”
I see no way to read this study without concluding that somewhere between 90%-95% of all Americans have either been vaccinated and/or infected (since 60% of the 34% unvaccinated amounts to only 13.6% of the population – and the unvaccinated have had confirmed cases at a *much* higher rate than the vaccinated). This is going to put enormous evolutionary pressure on the virus in the direction of immune avoidance. I think this also strongly suggests that the fatality rate will continue to decline.
So we will await the next variant, which if it arrives 3-4 months after BA.2.12.1, will be in June or July.
