The tide has now turned as to house prices Last month I wrote that the FHFA showed evidence that house prices had peaked, and that “since the FHFA has a tendency to turn slightly ahead of the Case Shiller index, this strongly suggests that a sharp deceleration in the Case Shiller index YoY will start within a month or two.” That was borne out in this morning’s reports for August house prices. The FHFA purchase only index, which is seasonally adjusted, indicated that house prices declined -0.7% in August, after a -0.6% decline in July, which is a total -1.3% decline from its peak two months ago in June. The index remains higher by 11.9% YoY. Meanwhile the Case Shiller national index declined -1.1% in August – but is not seasonally
Topics:
NewDealdemocrat considers the following as important: Hot Topics, House prices, Taxes/regulation, US EConomics
This could be interesting, too:
NewDealdemocrat writes JOLTS revisions from Yesterday’s Report
Joel Eissenberg writes No Invading Allies Act
Bill Haskell writes The North American Automobile Industry Waits for Trump and the Gov. to Act
Bill Haskell writes Families Struggle Paying for Child Care While Working
The tide has now turned as to house prices
Last month I wrote that the FHFA showed evidence that house prices had peaked, and that “since the FHFA has a tendency to turn slightly ahead of the Case Shiller index, this strongly suggests that a sharp deceleration in the Case Shiller index YoY will start within a month or two.”
That was borne out in this morning’s reports for August house prices.
The FHFA purchase only index, which is seasonally adjusted, indicated that house prices declined -0.7% in August, after a -0.6% decline in July, which is a total -1.3% decline from its peak two months ago in June. The index remains higher by 11.9% YoY.
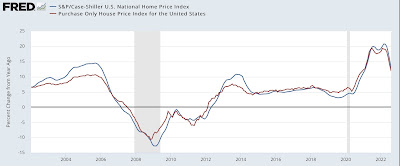
Meanwhile the Case Shiller national index declined -1.1% in August – but is not seasonally adjusted, so the YoY% change is the only good comparison. This was up 13.0%. My rule of thumb for non-seasonally adjusted data is that it has peaked when the YoY% change is less than 1/2 of its maximum. In the case of the Case Shiller index, which peaked at 20.8% YoY in March, this suggests that the index is perhaps one month from peaking. But since we know that the seasonally adjusted FHFA index has peaked, most likely my rule of thumb is off by a couple of months, and the Case Shiller index has peaked as well.
Here is the graph of the YoY trends:

As I have written many times in the past decade, first sales peak, then prices peak with a lag. That is what has happened this year.
The question now is, how far down do house prices go? In the 2007-11 bust, house prices fell a little over -20%. But in the smaller 1990-91 downturn, prices only declined about -3%.
The run-up in prices this time has been very similar to that during the 2000’s housing bubble, but lending practices were much less lax – meaning there should be far fewer foreclosures than during the housing bust. Those foreclosures – forced sales – helped drive prices lower, as the markets were flooded involuntarily with houses for sale. This time around, it is more likely that “underwater” homeowners, whose houses are no longer worth what they paid for them, will not suffer foreclosure, but rather will be frozen in place, unable to sell.
I have seen guesstimates of a -5% to -10% decline in house prices in this downturn, and that is a reasonable first dart-throw, although my guesstimate would be at the -10% end of that range. That’s because the Fed seems hell-bent on causing a sharp recession, and that recession will bring lots of joblessness, which in turn will mean more people unable to make mortgage payments, and so suffering foreclosure.
Anyway, the bottom line is that as to house prices, the tide has now turned.
“When will housing construction turn down? A fuller consideration,” Angry Bear
