A housing warning: affordability, at long last, is approaching its housing bubble nadir If current price and mortgage trends hold, we are about 6 to 12 months away from matching the very worst housing affordability at the peak of the housing bubble. Let’s start with a comparison of existing home sales (blue, reported today for January), new home sales (gray), and mortgage rates for the past 16 months: Note that the NAR doesn’t permit FRED to show sales more than 12 months previously – but here is the graph I ran 6 months ago: The bottom line is that both existing and new home sales declined – with the typical delay of 3 to 6 months – in response to moderately higher interest rates early last year. When interest rates declined again
Topics:
NewDealdemocrat considers the following as important: Housing Bubble, US EConomics, US/Global Economics
This could be interesting, too:
NewDealdemocrat writes JOLTS revisions from Yesterday’s Report
Bill Haskell writes The North American Automobile Industry Waits for Trump and the Gov. to Act
Bill Haskell writes Families Struggle Paying for Child Care While Working
Joel Eissenberg writes Time for Senate Dems to stand up against Trump/Musk
A housing warning: affordability, at long last, is approaching its housing bubble nadir
If current price and mortgage trends hold, we are about 6 to 12 months away from matching the very worst housing affordability at the peak of the housing bubble.
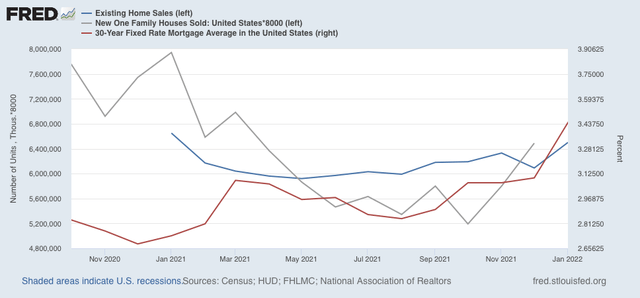
Let’s start with a comparison of existing home sales (blue, reported today for January), new home sales (gray), and mortgage rates for the past 16 months:
Note that the NAR doesn’t permit FRED to show sales more than 12 months previously – but here is the graph I ran 6 months ago:
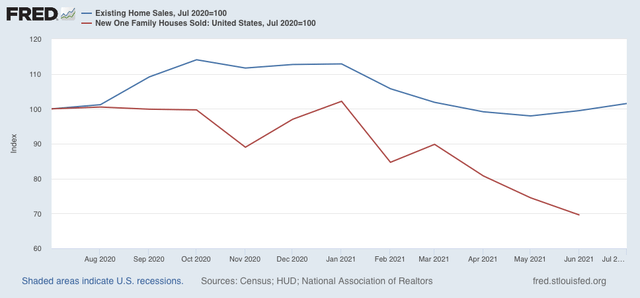
The bottom line is that both existing and new home sales declined – with the typical delay of 3 to 6 months – in response to moderately higher interest rates early last year. When interest rates declined again during autumn, new and existing home sales responded – again, with a delay – by heading higher.
Now here is what mortgage rates look like up through this week:
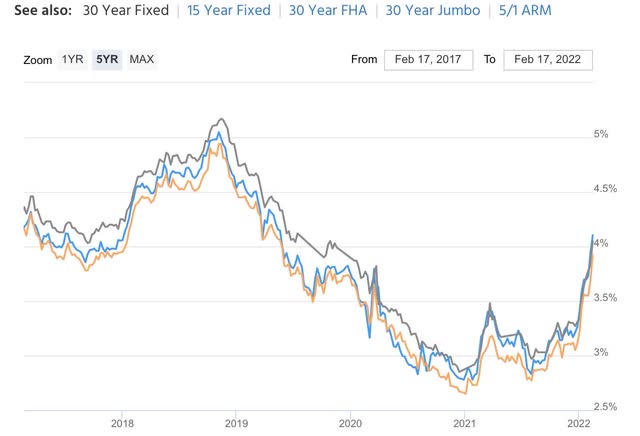
Mortgage rates have jumped by about 0.75% since January 1, only 7 weeks ago.
The saving grace in the housing market for the past several years has been that, while the down payment cost of a home was the highest ever in comparison with household earnings, mortgage rates were so low that the monthly carrying costs were nevertheless relatively modest. The NAR publishes a “Housing Affordability Index” taking that into account. Here is the long term view:
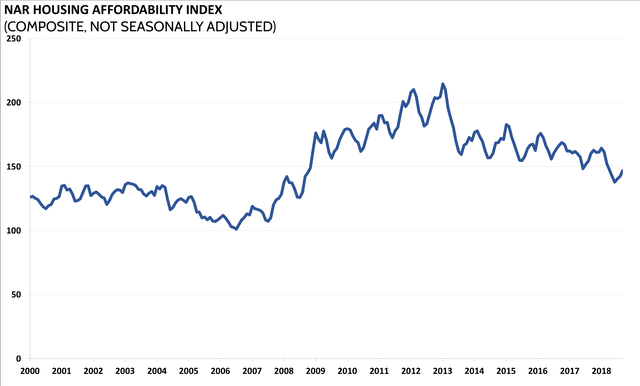
And here is the latest graph through December:
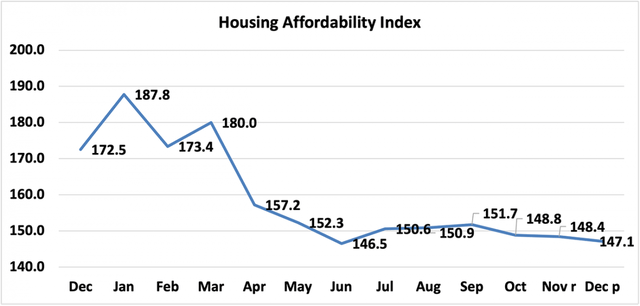
Thus this does *not* include the jump in mortgage rates in January and this month so far. And bear in mind that since the house price component of the index is not seasonally adjusted, and January is typically the nadir for house prices, we can expect this index to deteriorate substantially in the next several months.
In fact, by my calculations, this most recent jump in mortgage rates makes monthly mortgage costs the highest since about 2007, and only about 15-20% lower in real terms than at their worst at the peak of the housing bubble in 2005. And if house prices continue to appreciate during the next 6-9 months the way they have for the past 24 months, we will match that peak.
Prices follow sales, and after the last few buyers lock in sales before mortgage rates go higher, I fully expect sales to decline substantially, and prices to follow suit once they hit their breaking point later this year.
