RJS: Oil supplies at a 10 year low; SPR at a 19 year low; total oil & products supplies at 7 1/2 year low after across-the-board draw The Latest US Oil Supply and Disposition Data from the EIA US oil data from the US Energy Information Administration for the week ending February 4th indicated that after a drop in our oil imports, a jump in our oil exports, and an increase in our refining, we again had to pull oil out of our stored commercial crude supplies (see above chart) for the ninth time in 11 weeks and for the 25th time in the past thirty-seven weeks . . . our imports of crude oil fell by an average of 696,000 barrels per day to an average of 6,389,000 barrels per day, after rising by an average of 849,000 barrels per day during the
Topics:
run75441 considers the following as important: Focus on Fracking, Hot Topics, MarketWatch 666, RJS, US/Global Economics
This could be interesting, too:
NewDealdemocrat writes JOLTS revisions from Yesterday’s Report
Joel Eissenberg writes No Invading Allies Act
Joel Eissenberg writes How Tesla makes money
NewDealdemocrat writes January JOLTS report: monthly increases, but significant downward revisions to 2024
RJS: Oil supplies at a 10 year low; SPR at a 19 year low; total oil & products supplies at 7 1/2 year low after across-the-board draw
The Latest US Oil Supply and Disposition Data from the EIA
US oil data from the US Energy Information Administration for the week ending February 4th indicated that after a drop in our oil imports, a jump in our oil exports, and an increase in our refining, we again had to pull oil out of our stored commercial crude supplies (see above chart) for the ninth time in 11 weeks and for the 25th time in the past thirty-seven weeks . . . our imports of crude oil fell by an average of 696,000 barrels per day to an average of 6,389,000 barrels per day, after rising by an average of 849,000 barrels per day during the prior week, while our exports of crude oil rose by an average of 724,000 barrels per day to an average of 3,100,000 barrels per day during the week, which together meant that our effective trade in oil worked out to a net import average of 3,289,000 barrels of per day during the week ending February 4th, 1,420,000 fewer barrels per day than the net of our imports minus our exports during the prior week . . . over the same period, production of crude oil from US wells was reportedly 100,000 barrels per day higher at 11,600,000 barrels per day, and hence our daily supply of oil from the net of our international trade in oil and from domestic well production appears to have totaled an average of 14,889,000 barrels per day during the cited reporting week…
Meanwhile, US oil refineries reported they were processing an average of 15,577,000 barrels of crude per day during the week ending February 4th, an average of 328,000 more barrels per day than the amount of oil than our refineries processed during the prior week, while over the same period the EIA’s surveys indicated that a net of 879,000 barrels of oil per day were being pulled out the supplies of oil stored in the US . . . so based on that reported & estimated data, this week’s crude oil figures from the EIA appear to indicate that our total working supply of oil from net imports, from storage, and from oilfield production was 191,000 barrels per day more than what our oil refineries reported they used during the week . . . to account for that disparity between the apparent supply of oil and the apparent disposition of it, the EIA just inserted a (-191,000) barrel per day figure onto line 13 of the weekly U.S. Petroleum Balance Sheet to make the reported data for the daily supply of oil and the consumption of it balance out, essentially a balance sheet fudge factor that they label in their footnotes as “unaccounted for crude oil”, thus suggesting there must have been an error or omission of that magnitude in this week’s oil supply & demand figures that we have just transcribed . . . however, since last week’s EIA fudge factor was at (-1,377,000) barrels per day, that means there was still a 1,185,000 barrel per day difference between this week’s balance sheet error and the EIA’s crude oil balance sheet error from a week ago, and hence the week over week supply and demand changes indicated by this week’s report are completely worthless . . . however, since most everyone treats these weekly EIA reports as gospel and since these figures often drive oil pricing, and hence decisions to drill or complete oil wells, we’ll continue to report this data just as it’s published, and just as it’s watched & believed to be reasonably accurate by most everyone in the industry . . . (for more on how this weekly oil data is gathered, and the possible reasons for that “unaccounted for” oil, see this EIA explainer)….
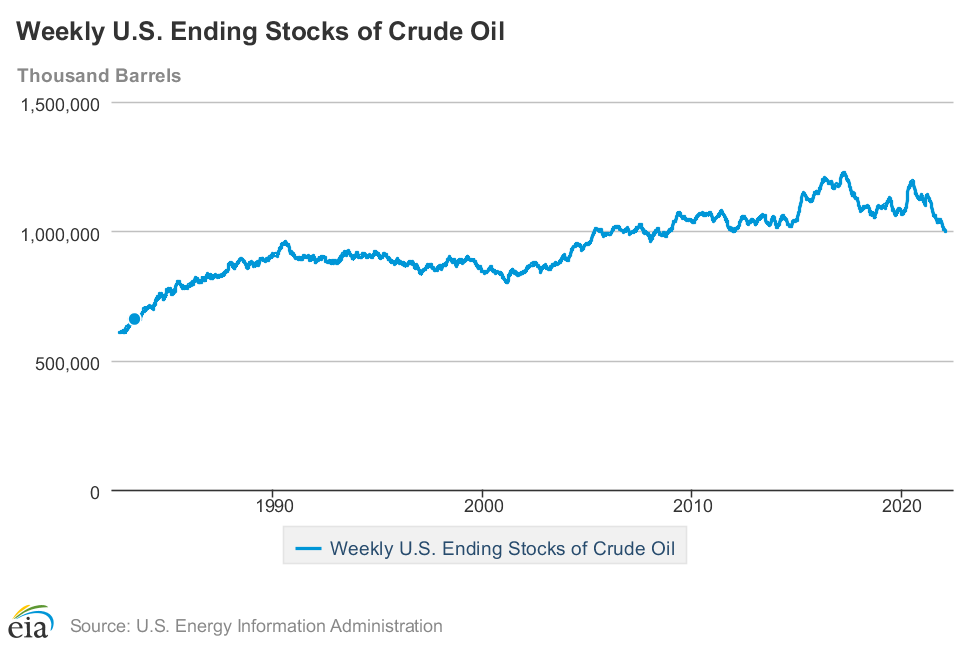
This week’s 879,000 barrel per day decrease in our overall crude oil inventories left our total oil supplies at 997,902,000 barrels, the lowest since December 12th, 2011, and therefore at a new 10 year low . . . this week’s oil inventory decrease came as 679,000 barrels per day were being pulled out of our commercially available stocks of crude oil, while 200,000 more barrels per day of oil were being pulled out of our Strategic Petroleum Reserve, part of the first installment of Biden’s plan to release 50 million barrels from the SPR, in order to incentive continued use of US gas guzzlers . . . including the drawdowns from the Strategic Petroleum Reserve under such politically motivated programs, a total of 68,634,000 barrels have been removed from the Strategic Petroleum Reserve over the past 18 months, and as a result the 587,515,000 barrels of oil left in our Strategic Petroleum Reserve is now the lowest since October 4th, 2002, or at yet another new 19 year low, as repeated tapping of our emergency supplies for political reasons or to “pay for” other programs had already drained those supplies considerably over the past dozen years . . . based on an estimated prepandemic consumption level of around 18 million barrels per day, the US will have roughly 30 1/2 days of oil supply left in the Strategic Petroleum Reserve when the Biden program is complete…
Further details from the weekly Petroleum Status Report (pdf) indicate that the 4 week average of our oil imports rose to an average of 6,614,000 barrels per day last week, which was 12.7% more than the 5,868,000 barrel per day average that we were importing over the same four-week period last year . . . this week’s crude oil production was reported to be 100,000 barrels per day higher at 11,600,000 barrels per day even though the EIA’s rounded estimate of the output from wells in the lower 48 states was unchanged at 11,100,000 barrels per day, because Alaska’s oil production was 12,000 barrels per day higher at 456,000 barrels per day and therefore added 100,000 barrels per day to the rounded national production total (by the EIA’s math)…US crude oil production had reached a pre-pandemic high of 13,100,000 barrels per day during the week ending March 13th 2020, so this week’s reported oil production figure was 11.5% below that of our pre-pandemic production peak, but 37.6% above the interim low of 8,428,000 barrels per day that US oil production had fallen to during the last week of June of 2016…
US oil refineries were operating at 88.2% of their capacity while using those 15,577,000 barrels of crude per day during the week ending February 4th, up from a utilization rate of 86.7% the prior week, but a bit lower than the historical utilization rate for early February refinery operations . . . the 15,577,000 barrels per day of oil that were refined this week were 5.3% more barrels than the 14,793,000 barrels of crude that were being processed daily during the pandemic impacted week ending February 5th of 2021, but still 2.8% less than the 16,020,000 barrels of crude that were being processed daily during the week ending February 7th, 2020, when US refineries were operating at what was then also a below normal 87.5% of capacity…
With the big increase in oil being refined this week, gasoline output from our refineries was also much higher, increasing by 740,000 barrels per day to 8,650,000 barrels per day during the week ending February 4th, after our gasoline output had decreased by 267,000 barrels per day over the prior week . . . this week’s gasoline production was 8.5% more than the 8,656,000 barrels of gasoline that were being produced daily over the same week of last year, and 1.6% more than the gasoline production of 9,241,000 barrels per day during the week ending February 7th, 2020 . . . at the same time, our refineries’ production of distillate fuels (diesel fuel and heat oil) increased by 97,000 barrels per day to 4,699,000 barrels per day, after our distillates output had decreased by 148,000 barrels per day over the prior week . . . after that increase, our distillates output was fractionally more than the 4,660,000 barrels of distillates that were being produced daily during the week ending February 5th of 2021, but 2.9% less than the 4,837,000 barrels of distillates that were being produced daily during the week ending January 31st, 2020…
Even with the increase in our gasoline production, our supplies of gasoline in storage at the end of the week fell for the third time in the past 11 weeks, decreasing by 1,644,000 barrels to 248,393,000 barrels during the week ending February 4th,after our gasoline inventories had increased by a near record 27,378,000 barrels over the prior five weeks . . . our gasoline supplies decreased this week because the amount of gasoline supplied to US users increased by 900,000 barrels per day to 9,126,000 barrels per day, even as our imports of gasoline rose by 81,000 barrels per day to 514,000 barrels per day, and as our exports of gasoline fell by 334,000 barrels per day to 306,000 barrels per day . . . after this week’s decrease, our gasoline supplies were 3.1% lower than last February 5th’s gasoline inventories of 256,412,000 barrels, and are now about 3% below the five year average of our gasoline supplies for this time of the year…
Despite this week’s increase in our distillates production, our supplies of distillate fuels decreased for the seventeenth time in twenty-four weeks, falling by 930,000 barrels to 121,814,000 barrels during the week ending February 4th, after our distillates supplies had decreased by 2,410,000 barrels during the prior week . . . our distillates supplies fell again this week even though the amount of distillates supplied to US markets, an indicator of our domestic demand, fell by 373,000 barrels per day to 4,296,000 barrels per day, because our exports of distillates rose by 449,000 barrels per day to 976,000 barrels per day, while our imports of distillates rose by 190,000 barrels per day to 440,000 barrels per day . . . after thirty inventory decreases over the past forty-four weeks, our distillate supplies at the end of the week were 24.4% below the 161,106,000 barrels of distillates that we had in storage on February 5th of 2021, and about 19% below the five year average of distillates inventories for this time of the year…
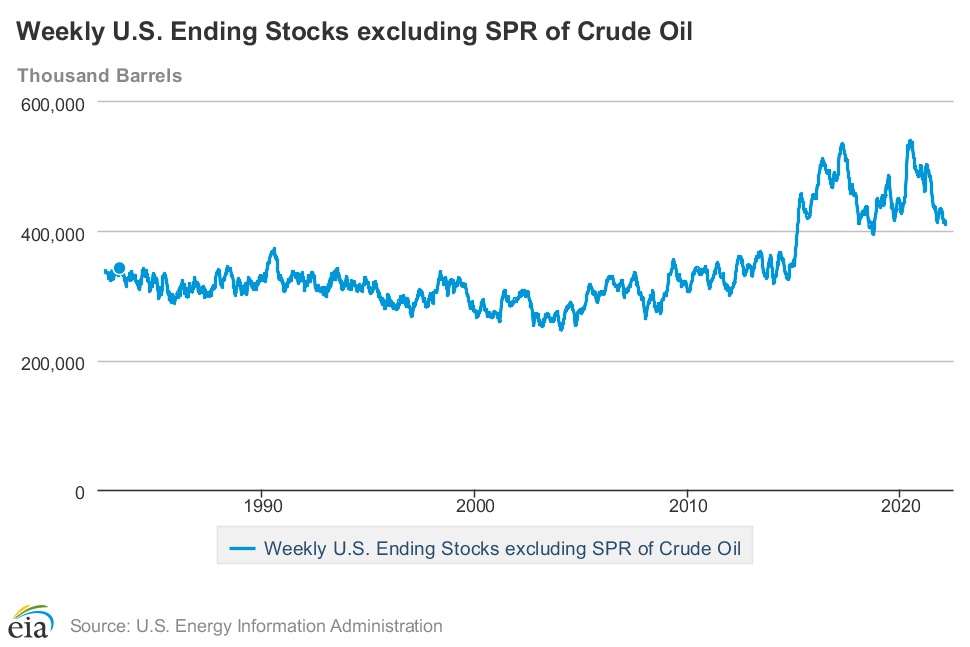
Meanwhile, drop in our oil imports, a jump in our oil exports, and an increase in our refining, our commercial supplies of crude oil in storage fell for the 18th time in 27 weeks and for the 34th time in the past year, decreasing by 4,756,000 barrels over the week, from 415,143,000 barrels on January 28th to a 39 month low of 410,387,000 barrels on February 4th, after our commercial crude supplies had decreased by 1,047,000 barrels over the prior week . . . after this week’s decrease, our commercial crude oil inventories fell to about 11% below the most recent five-year average of crude oil supplies for this time of year, but were still about 28% above the average of our crude oil stocks as of first weekend of February over the 5 years at the beginning of the past decade, with the disparity between those comparisons arising because it wasn’t until early 2015 that our oil inventories first topped 400 million barrels . . . since our crude oil inventories had jumped to record highs during the Covid lockdowns of spring 2020 and remained elevated for most of a year after that, our commercial crude oil supplies as of this February 4th were 12.5% less than the 469,014,000 barrels of oil we had in commercial storage on February 5th of 2021, and are now 7.2% less than the 442,468,000 barrels of oil that we had in storage on February 7th of 2020, and also 8.9% less than the 450,840,000 barrels of oil we had in commercial storage on February 8th of 2019…

Finally, with our inventory of crude oil and our supplies of all products made from oil all near multi year lows, we are continuing to track the total of all U.S. Stocks of Crude Oil and Petroleum Products, including those in the SPR . . . the EIA’s data shows that the total of our oil and oil product inventories, including those in the Strategic Petroleum Reserve and those held by the oil industry, and thus including everything from gasoline and jet fuel to propane/propylene and residual fuel oil, fell by 9,449,000 barrels this week, from 1,767,813,000 barrels on January 28th to1,758,364,000 barrels on February 4th . . . that leaves our total supplies of oil & its products now at the lowest since May 30th, 2014, or at a fresh seven and a half year low, despite the recent near record increase in gasoline inventories….