June house price indexes show no peak yet; no respite likely in the “official” consumer housing measure Yesterday the Case Shiller and FHFA house price indexes were updated through June (technically, the average of April through June. Because the Case Shiller index is not seasonally adjusted, the best way to show them is YoY. Here are YoY% changes for the last 2 years of each (although the FHFA *is* seasonally adjusted, and increased only +0.1% for the month to a new record): Remember, my rule of thumb for non-seasonally adjusted data is that the peak is most likely when the YoY gain declines to only 1/2 of its maximum in the last 12 months. By that standard, although both decelerated to 12 month lows, at +18.0% and 16.2% respectively, this
Topics:
NewDealdemocrat considers the following as important: New Deal Democrat, US EConomics
This could be interesting, too:
NewDealdemocrat writes JOLTS revisions from Yesterday’s Report
Bill Haskell writes The North American Automobile Industry Waits for Trump and the Gov. to Act
Bill Haskell writes Families Struggle Paying for Child Care While Working
Joel Eissenberg writes Time for Senate Dems to stand up against Trump/Musk
June house price indexes show no peak yet; no respite likely in the “official” consumer housing measure
Yesterday the Case Shiller and FHFA house price indexes were updated through June (technically, the average of April through June.
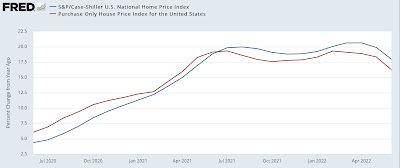
Because the Case Shiller index is not seasonally adjusted, the best way to show them is YoY. Here are YoY% changes for the last 2 years of each (although the FHFA *is* seasonally adjusted, and increased only +0.1% for the month to a new record):

Remember, my rule of thumb for non-seasonally adjusted data is that the peak is most likely when the YoY gain declines to only 1/2 of its maximum in the last 12 months. By that standard, although both decelerated to 12 month lows, at +18.0% and 16.2% respectively, this is not much below their recent highs of 20.6% and 19.3% earlier this year.
Also, the FHFA has a tendency to turn slightly ahead of the Case Shiller index, and the FHFA YoY gains appear to have peaked in February, slightly ahead of Case Shiller.
Anyway, these two indexes are telling us – with a delay – that prices did not peak during the spring.
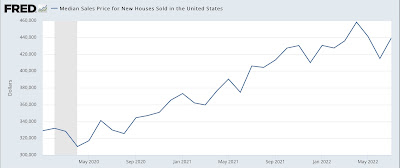
Remember that the median price for new homes appears to have peaked in April (below data *is* seasonally adjusted):

Additionally, below are the YoY% changes for every month in median existing home sales prices for the past 15 months (again, the NAR does not seasonally adjust this data):
Apr 2021 +19.1%
May +23.6% [peak]
Jun +23%
Jul +20%
Aug +15%
Sep +13%
Oct +13.1%
Nov +13.9%
Dec 2021 +15.8%
Jan 2022+15.4%
Feb 2022 +15%
Mar 2022 +15%
Apr 2022 +10.4% [lowest]
May 2022 +14.8%
June 2022 +13.4%
July 2022 +10.8%
The price of existing homes appears to be close to a peak as of the last 4 months.
Put all this together, and the result is that while prices for new homes probably peaked several months ago, existing home prices were still increasing as of mid year. It will take another month or two to know if they peaked during the summer.
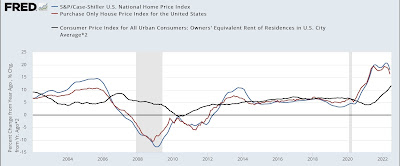
Finally, as I have written many times over the past 9 months, the CPI measure of housing, “owners equivalent rent,” lags actual house prices by about a year or more. Here are the YoY% changes of the house price indexes vs. OER(*2 for scale) over the past 20 years:

Through July, YoY% increases in OER have continued to accelerate. They may have more to go, or they may be close to their peak YoY. But I do not expect any meaningful downturn in OER, which plus rents contribute a full 1/3rd of the entire value of the CPI, aside from contributions from lower gas prices I see very little relief in the official inflation measure for months to come.
