New home sales for November: at last, a bright spot! (relatively speaking) New home sales are very volatile, and heavily revised. But they frequently are the first housing metrics to turn. And November’s new home sales report suggests that they may indeed have made their low. Last month new home sales increased to 640,000 annualized, from a downwardly revised 607,000 (vs. the original 632,000) in October. Here’s what the past year looks like (FRED hasn’t updated, so here’s the Census Bureau’s graph): The preliminary read for November is the highest number since March, with the exception of August’s 661,000. Now, a word of caution, but also a word of caution *about* that caution: we know that cancellation rates for new home contracts have
Topics:
NewDealdemocrat considers the following as important: New Home Sales, US EConomics
This could be interesting, too:
NewDealdemocrat writes JOLTS revisions from Yesterday’s Report
Bill Haskell writes The North American Automobile Industry Waits for Trump and the Gov. to Act
Bill Haskell writes Families Struggle Paying for Child Care While Working
Joel Eissenberg writes Time for Senate Dems to stand up against Trump/Musk
New home sales for November: at last, a bright spot! (relatively speaking)
New home sales are very volatile, and heavily revised. But they frequently are the first housing metrics to turn. And November’s new home sales report suggests that they may indeed have made their low.
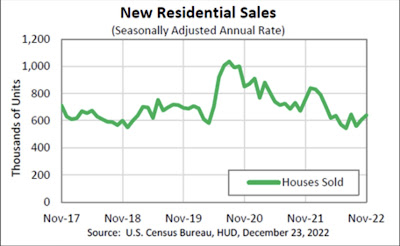
Last month new home sales increased to 640,000 annualized, from a downwardly revised 607,000 (vs. the original 632,000) in October. Here’s what the past year looks like (FRED hasn’t updated, so here’s the Census Bureau’s graph):

The preliminary read for November is the highest number since March, with the exception of August’s 661,000.
Now, a word of caution, but also a word of caution *about* that caution: we know that cancellation rates for new home contracts have increased sharply since springtime. So, that has made the *actual* sales numbers worse than the reported numbers. BUT, even taking them into account, as of October, the low point was July. I don’t have this month’s number for cancellations, so that might change. But also, there is no reason to think that there weren’t similar levels of cancellations during any of the other historical housing downturns brought about by increased mortgage rates. In other words, new home sales this year should have a comparable pattern to previous downturns.
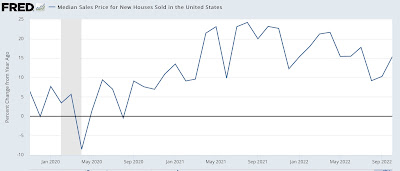
Finally, YoY prices were up 9.5% (this data is not seasonally adjusted) (again, FRED hasn’t updated, so here is the YoY% change through October:

Since this is less than 1/2 the highest % growth in the past 12 months, per my heuristic this indicates that house prices, if we could seasonally adjust, have actually started to decline.
As I’ve mentioned a number of times recently, I am on the lookout for long leading indicators that might suggest how long (or short) a recession we might be in for. At the moment, new home sales is suggesting the downturn may not be that long (Fed willing, of course).
“New Home Sales Fall Sharply . . .,” Angry Bear angry bear blog
