In response to April’s dismal report, I wrote that “new home sales are heavily revised after the first report. It is not unusual at all for big monthly moves like this to suddenly look much less severe when the number gets revised one month later. I would not be surprised in the slightest if that happened to this month’s cliff dive, when next month’s report comes out.” That’s exactly what happened, as last month was revised higher by 38,000 to 629,000 units annualized. May came in at 696,000. That’s still a big decline of -17% from their most recent peak last December, and -33% from their pandemic peak of August 2020 (blue in the graph below): This is frequently – but not always! – consistent with an oncoming recession. The particular
Topics:
NewDealdemocrat considers the following as important: Healthcare, New Home Sales, politics, Prices climb, US EConomics
This could be interesting, too:
Robert Skidelsky writes Lord Skidelsky to ask His Majesty’s Government what is their policy with regard to the Ukraine war following the new policy of the government of the United States of America.
NewDealdemocrat writes JOLTS revisions from Yesterday’s Report
Joel Eissenberg writes No Invading Allies Act
Ken Melvin writes A Developed Taste
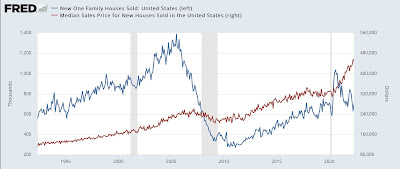
In response to April’s dismal report, I wrote that “new home sales are heavily revised after the first report. It is not unusual at all for big monthly moves like this to suddenly look much less severe when the number gets revised one month later. I would not be surprised in the slightest if that happened to this month’s cliff dive, when next month’s report comes out.”
That’s exactly what happened, as last month was revised higher by 38,000 to 629,000 units annualized. May came in at 696,000.
That’s still a big decline of -17% from their most recent peak last December, and -33% from their pandemic peak of August 2020 (blue in the graph below):

This is frequently – but not always! – consistent with an oncoming recession.
The particular value of new home sales is that, although it is a very noisy number, they frequently do peak and trough before either permits or starts, and did so again during this expansion. So for sales, this month was further confirmation that the declining trend is intact.
As to prices, in the graph above note that the median price of a new home (red) continued to rise.
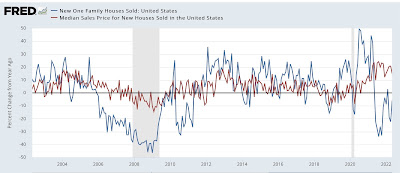
But the pace of the increase in prices has slowed considerably from +24% YoY last July to +15% in May:

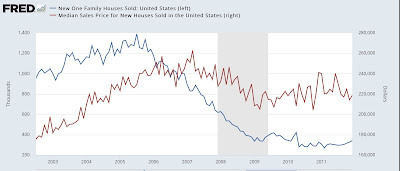
In the past, as shown by the below comparison with the housing bubble and bust, prices have continued to rise sometimes for over a year after sales went into steep declines:

So prices may continue to rise for a number of months more before stalling or declining (and as I indicated the other day, I now expect significant declines).
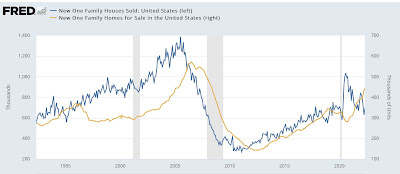
Finally, sales and prices both lead inventory, as shown in the below graph including sales (blue) and inventory (gold) of new homes for sale:

Inventory is increasing even as sales decline. This of course is yet another reason to expect outright price declines soon. Just not as of yet.
