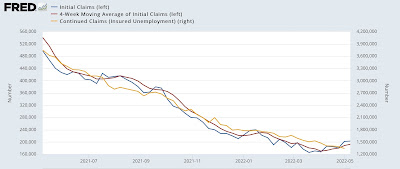
New jobless claims rise slightly, but continuing claims make another 50+ year low, May 12, 2022 – by New Deal democrat Initial jobless claims rose 1,000 to 203,000, continuing above the recent 50+ year low of 166,000 set in March. The 4 week average also rose by 4,250 to 192,750, compared with the all-time low of 170,500 set five weeks ago. On the other hand, continuing claims declined -44,000 to 1,343,000, yet another new 50 year low (but still well above their 1968 all-time low of 988,000): The graph above (click on graph to enlarge) shows a slight trend of increased new layoffs, which may or may not just be noise. In any event, the tightest market for keeping a job in half a century continues. With so many other data points
Topics:
NewDealdemocrat considers the following as important: continuing jobless claims, Hot Topics, jobless claims, US EConomics
This could be interesting, too:
NewDealdemocrat writes JOLTS revisions from Yesterday’s Report
Joel Eissenberg writes No Invading Allies Act
Bill Haskell writes The North American Automobile Industry Waits for Trump and the Gov. to Act
Bill Haskell writes Families Struggle Paying for Child Care While Working
New jobless claims rise slightly, but continuing claims make another 50+ year low, May 12, 2022
– by New Deal democrat
Initial jobless claims rose 1,000 to 203,000, continuing above the recent 50+ year low of 166,000 set in March. The 4 week average also rose by 4,250 to 192,750, compared with the all-time low of 170,500 set five weeks ago. On the other hand, continuing claims declined -44,000 to 1,343,000, yet another new 50 year low (but still well above their 1968 all-time low of 988,000):
The graph above (click on graph to enlarge) shows a slight trend of increased new layoffs, which may or may not just be noise. In any event, the tightest market for keeping a job in half a century continues. With so many other data points weakening, this is probably the brightest spot in the entire economy.

