November CPI: Thank you, gas prices! No thank you, owners’ equivalent rent – by New Deal democrat Just like producer prices as reported last Friday, consumer prices for November confirm the inflection point of last June. Thank you, lower gas prices! Here’s what total and core (ex-food and energy) inflation look like, normed to 100 in June: Since June, overall consumer inflation has increased 1.0%, so is increasing at a 2.2% annual rate. Core inflation has increased 1.9%, or a 4.7% annual rate. To cut to the sectorial chase, here is the breakdown of all the important categories, first m/m and second YoY: Total: +0.1%, +7.1% Core +0.2%, +6.0% Shelter +0.6%, +7.1% Food +0.5%, +10.6% Energy -1.6%, +13.1% New vehicles -0-,
Topics:
NewDealdemocrat considers the following as important: consumer price index, Hot Topics, US EConomics
This could be interesting, too:
NewDealdemocrat writes JOLTS revisions from Yesterday’s Report
Joel Eissenberg writes No Invading Allies Act
Bill Haskell writes The North American Automobile Industry Waits for Trump and the Gov. to Act
Bill Haskell writes Families Struggle Paying for Child Care While Working
November CPI: Thank you, gas prices! No thank you, owners’ equivalent rent
– by New Deal democrat
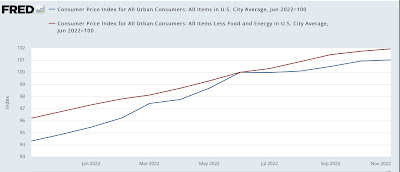
Just like producer prices as reported last Friday, consumer prices for November confirm the inflection point of last June. Thank you, lower gas prices! Here’s what total and core (ex-food and energy) inflation look like, normed to 100 in June:

Since June, overall consumer inflation has increased 1.0%, so is increasing at a 2.2% annual rate. Core inflation has increased 1.9%, or a 4.7% annual rate.
To cut to the sectorial chase, here is the breakdown of all the important categories, first m/m and second YoY:
Total: +0.1%, +7.1%
Core +0.2%, +6.0%
Shelter +0.6%, +7.1%
Food +0.5%, +10.6%
Energy -1.6%, +13.1%
New vehicles -0-, +7.2%
Used vehicles -2.9%, -3.3%
As you can see, there remain only two sources of major inflation: shelter and food. In particular, take shelter out of total inflation, and consumer prices since June are *deflating* by -0.3% at an annual rate, and core prices since June are increasing at a 2.2% annual rate.
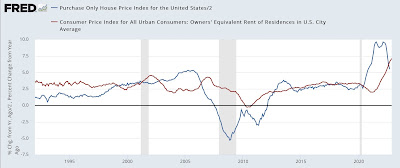
Further, as I’ve been pounding on for more than a year, “owners’ equivalent rent,” which is how house prices are measured for the CPI, lags badly, i.e., by a year or more. Here’s this morning’s update on what YoY house prices as measured by the FHFA (/2 for scale) look like compared with YoY owners’ equivalent rent:

As I anticipated, YoY OER has continued to increase, and is now up 7.1%. Meanwhile the FHFA house price index, through its latest reading for September, was up 11.0%.
The YoY increase in the FHFA price index has decreased by 33% in the past 4 months. At that rate actual house prices will be unchanged YoY by next April. Meanwhile I expect OER to continue to increase to 7.5% or so through winter.
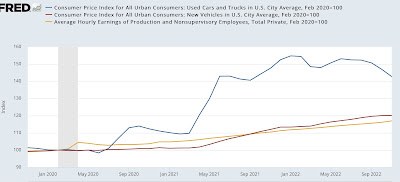
I also want to comment briefly about new and used vehicle prices. Nominally they have both increased sharply since the start of the pandemic, up over 20% and 40% respectively. However, since average hourly wages are up 17% since then, in real terms new vehicle prices are only up about 3%, while used vehicle prices are still up about 25%, despite their decline this year:

In shot, the big decline in gas prices is having a huge impact on consumer prices overall. Food and used vehicle prices in particular remain problems. But inflation remains distorted to the upside due to the way CPI measures house prices.
As I’ve said for the past several months, at this point the Fed, via interest rate increases, is chasing a phantom menace, needlessly causing a recession, or at least a deeper one than would be otherwise necessary to achieve its objectives.
