Coronavirus dashboard for January 10: how “mild” Omicron is depends upon how much you lag the data So, how “mild” or not, is Omicron? It depends on whether you lag the data on hospitalizations and deaths or not.The original story out of South Africa was that Omicron was extremely mild. Despite a huge spike in infections, deaths barely budged. As Omicron took hold in Europe and the US, South Africa disappeared from the picture. Which is too bad, because here is what has been happening with deaths: In the past week, deaths in South Africa tripled. Mind you, deaths – so far, anyway – at 13x their pre-Omicron low, are nowhere near the 80x+ increase in cases. But the point is, deaths lag cases, and until you wait about a month to see how
Topics:
NewDealdemocrat considers the following as important: coronavirus dashboard, Healthcare, omicron
This could be interesting, too:
Bill Haskell writes Families Struggle Paying for Child Care While Working
Joel Eissenberg writes RFK Jr. blames the victims
Joel Eissenberg writes The branding of Medicaid
Bill Haskell writes Why Healthcare Costs So Much . . .
Coronavirus dashboard for January 10: how “mild” Omicron is depends upon how much you lag the data
So, how “mild” or not, is Omicron? It depends on whether you lag the data on hospitalizations and deaths or not.
The original story out of South Africa was that Omicron was extremely mild. Despite a huge spike in infections, deaths barely budged. As Omicron took hold in Europe and the US, South Africa disappeared from the picture. Which is too bad, because here is what has been happening with deaths:
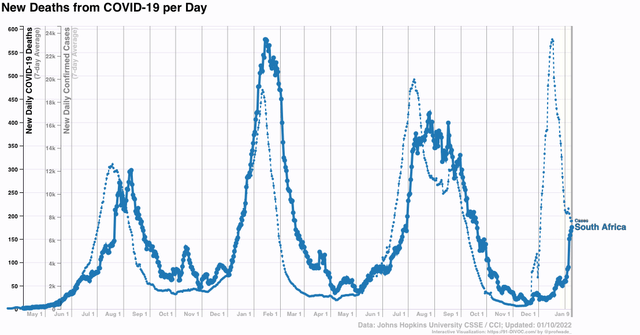
In the past week, deaths in South Africa tripled. Mind you, deaths – so far, anyway – at 13x their pre-Omicron low, are nowhere near the 80x+ increase in cases. But the point is, deaths lag cases, and until you wait about a month to see how deaths play out, you really don’t know how “mild” Omicron is.
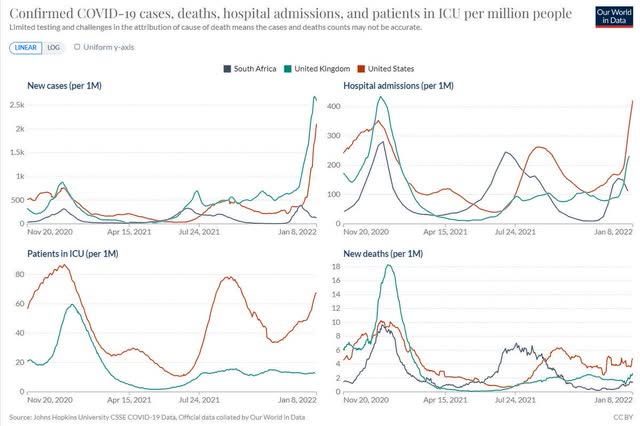
And the bad news for the US is, compared with South Africa and even the UK, Omicron hasn’t been as “mild” so far, as shown in the below set of graphs comparing cases, hospitalizations, ICU admissions, and deaths (again, so far):
A week ago, the story in the US was still how “mild” Omicron has been, as shown in this graph of cases, hospitalizations, and deaths from New York City (perhaps the earliest hard hit metro area):
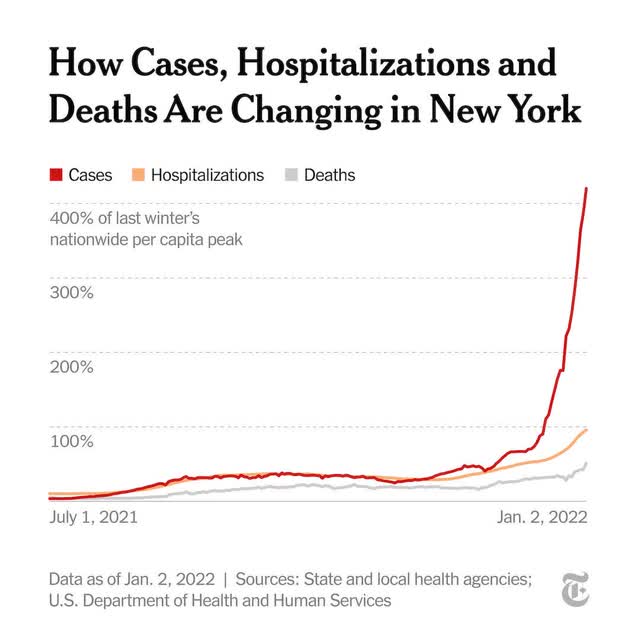
There’s just one problem with the above graph: hospitalizations and deaths aren’t shown with any sort of lag. Deaths on January 2 are compared with hospitalizations on January 2 and new cases on January 2.
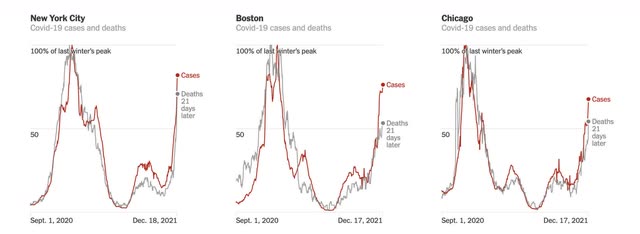
But when you put in an appropriate lag, the situation looks much different, as in the below graph in which deaths are lagged 21 days for NYC and two other metros:
Or the below graph, including ICU patients with a 14 day lag compared with infections:
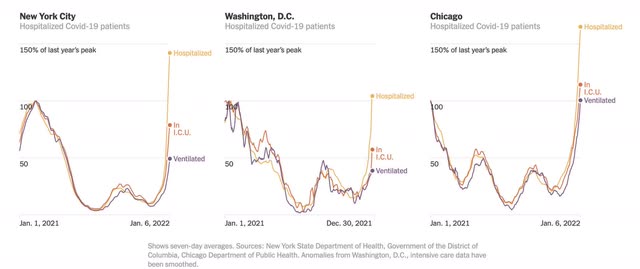
All of a sudden, Omicron doesn’t appear that much milder at all.
This is something I’ve been following since the onset of the Omicron wave. Since hospitalizations started to spike about 10 days after the onset of the wave, i crunched data with a 10 day lag. While I don’t have a graph to show you, I can tell you that each time I have done this, it gives me a result of hospitalizations increasing at a rate of between 65% to 80% of cases. ICU admissions lag hospitalizations by only a day or two and have gone up at about 50% of the rate of cases. Because the Omicron wave only started in earnest on December 15, 3 1/2 weeks ago, we are only beginning to see the trend in deaths.
But we already have more hospitalizations for COVID than we have ever had before in the US, and the system is beginning to break down – and we haven’t even reached the peak yet. As a society, the US seems to have just given up.
Since I hate only passing on gloom and doom, let me give you a few rays of daylight.
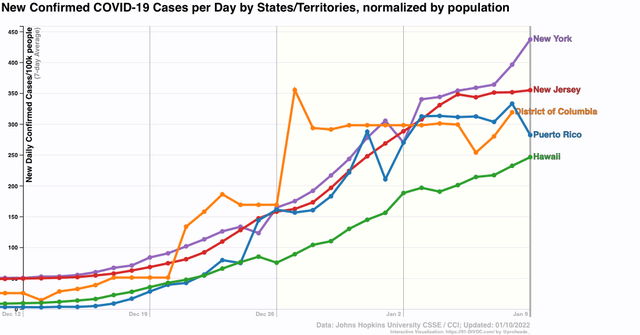
First, the Omicron wave seems to have already peaked in several places where it hit early: Puerto Rico, DC, and New Jersey. In two other places, New York and Hawaii, it hasn’t peaked yet:
Finally, Omicron is infecting so many people that within a month or two it is going to be difficult for COVID to find a victim who doesn’t have at least some resistance via vaccinations or prior infection:
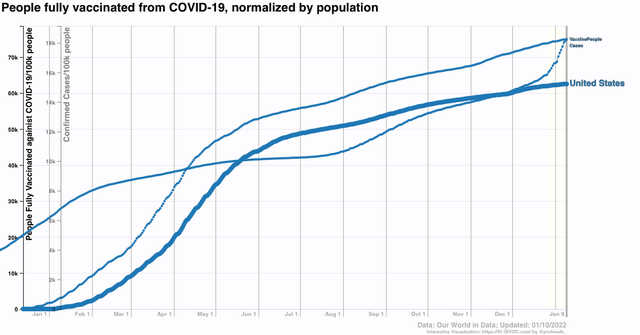
About 62% of the US population has been fully vaccinated (but only about 36% being boosted as well, according to the CDC). Another 12% have received at least one dose. And over 18% have had *confirmed* cases. The likelihood is that, including asymptomatic infections or infections of people who didn’t bother to get tested, at least double that percentage, somewhere on the order of 40% of all Americans, have been infected.
If we just randomly assign that 40% of infected people among all those vaccinated and unvaccinated, that’s roughly 85% of the US population that should have at least *some* resistance to renewed infection. Another month of Omicron is probably going to take that up to 90%.
It’s possible there is a doomsday variant out there, but it’s more likely that, as COVID becomes endemic, each wave displays less and less virulence, not because they are inherently “milder,” but simply because the vast majority of the population has some, increasing, level of immune resistance.
