Prices soar, sales drop; oh by the way, sales lead prices New home sales declined -8.6% in March, which isn’t as sharp as it seems since declines of this magnitude happen 2-3x/year. The series is also heavily revised, so no new month’s number should be given too much weight. On the other hand, new home sales are frequently the first series to decline after a peak, so the fact that they have not made a new high since January of last year, and are now almost 25% below that mark is certainly a sign that higher interest rates and prices have taken their toll: Very much on the other hand, the month over month % change in both the Case Shiller and FHFA Indexes rose at record paces of ~2% last month alone: All of this has caused the
Topics:
NewDealdemocrat considers the following as important: house price increases, US EConomics, US/Global Economics
This could be interesting, too:
NewDealdemocrat writes JOLTS revisions from Yesterday’s Report
Bill Haskell writes The North American Automobile Industry Waits for Trump and the Gov. to Act
Bill Haskell writes Families Struggle Paying for Child Care While Working
Joel Eissenberg writes Time for Senate Dems to stand up against Trump/Musk
Prices soar, sales drop; oh by the way, sales lead prices
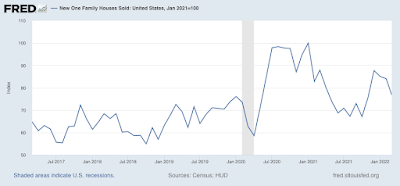
New home sales declined -8.6% in March, which isn’t as sharp as it seems since declines of this magnitude happen 2-3x/year. The series is also heavily revised, so no new month’s number should be given too much weight. On the other hand, new home sales are frequently the first series to decline after a peak, so the fact that they have not made a new high since January of last year, and are now almost 25% below that mark is certainly a sign that higher interest rates and prices have taken their toll:
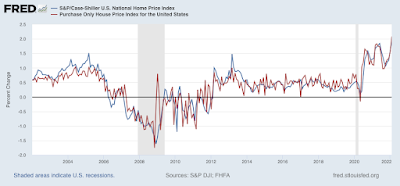
Very much on the other hand, the month over month % change in both the Case Shiller and FHFA Indexes rose at record paces of ~2% last month alone:
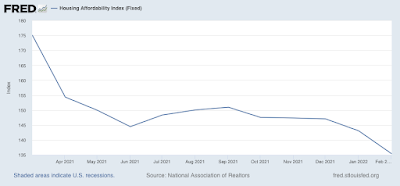
All of this has caused the National Affordability Index kept by Realtor.com to decline to 135:
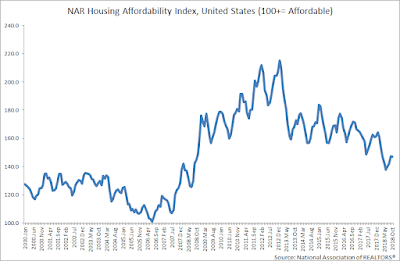
This is the lowest level of affordability since 2008 (note below graph stops in 2018)
And as I always say, sales lead prices, so here is the YoY% change in sales (averaged quarterly, blue) vs. both FHFA and Case Shiller prices:
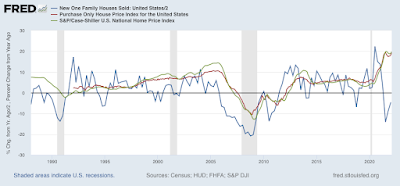
So it shouldn’t take a genius to figure out where I think home prices are headed.
