Real aggregate payrolls and sales There seems to be some pushback against the narrative that real wages have declined, based on compositional effects (lower pay occupations vs. higher pay occupations). While some of that is true (for example, 5/6’s of all leisure and hospitality losses have been recovered, vs. 3.4% actual job *gains* since February 2020 in professional and business services; and a 91% rebound among total payrolls) – it is far less a factor than it was 18 or even 12 months ago. Another way around that is to look at *aggregate* payrolls, particularly for nonsupervisory employees. This takes out the distortions introduced by outsized pay increases for the bosses, and also takes into account the total hours of pay earned in the
Topics:
NewDealdemocrat considers the following as important: payrolls, sales, US EConomics
This could be interesting, too:
NewDealdemocrat writes JOLTS revisions from Yesterday’s Report
Bill Haskell writes The North American Automobile Industry Waits for Trump and the Gov. to Act
Bill Haskell writes Families Struggle Paying for Child Care While Working
Joel Eissenberg writes Time for Senate Dems to stand up against Trump/Musk
Real aggregate payrolls and sales
There seems to be some pushback against the narrative that real wages have declined, based on compositional effects (lower pay occupations vs. higher pay occupations). While some of that is true (for example, 5/6’s of all leisure and hospitality losses have been recovered, vs. 3.4% actual job *gains* since February 2020 in professional and business services; and a 91% rebound among total payrolls) – it is far less a factor than it was 18 or even 12 months ago.
Another way around that is to look at *aggregate* payrolls, particularly for nonsupervisory employees. This takes out the distortions introduced by outsized pay increases for the bosses, and also takes into account the total hours of pay earned in the economy. Since aggregate real payrolls are also a good, fundamentals based coincident indicator for the economy as a whole, let’s take a look at them, and compare them with the consumption side as represented by real retail sales.
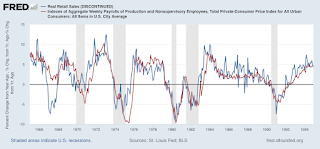
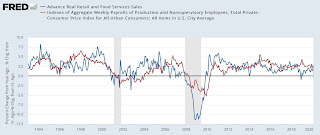
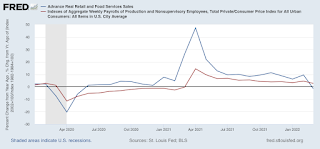
Here is the YoY% change in both real aggregate retail sales (blue) vs. real aggregate payrolls over 3 time periods going back 75 years:
1948-1994 (old retail sales index):
1994-2020 (new index, pre-pandemic):
2020-present (pandemic era):
In general, although both are noisy, real sales slightly lead (by several months) real aggregate payrolls, with the one notable exception of the late 1990s tech boom.
As I noted yesterday, a YoY decline in real retail sales has been a very reliable indicator of an oncoming recession during the past 75 years. YoY real aggregate payrolls have generally turned down right at the beginning of the recession itself. Thus, the YoY decline in March in real sales would ordinarily be very concerning. I am discounting it somewhat because it is in comparison with the March and April 2021 stimulus splurge. If the YoY decline were to continue into May, that would be a very real concern.
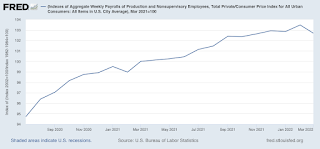
For now, as shown in the graph below, real aggregate nonsupervisory payrolls are up 2.6% from one year ago, and the trend has been higher:
While the consumer may not be as strong as they were a year ago, they aren’t rolling over yet either.


