Signs and portents of an employment slowdown and a near-term recession – by New Deal democrat I continue to believe that a recession – possibly a deep if relatively brief one – is likely to start early next year. As I’ve mentioned before, this isn’t just an academic exercise; recessions by definition feature jobs and income losses, which is my primary interest. With that introduction, let’s look at one overall metric, and several which will be updated tomorrow as part of the September jobs report. First of all, if there were such a thing (ex- pandemic lockdowns) as a one quarter recession, courtesy of last week’s income revisions we almost certainly had one during Q2. Here’s a graph of most of the metrics relied upon by the NBER in dating
Topics:
NewDealdemocrat considers the following as important: near-term recession, New Deal Democrat, US EConomics
This could be interesting, too:
NewDealdemocrat writes JOLTS revisions from Yesterday’s Report
Bill Haskell writes The North American Automobile Industry Waits for Trump and the Gov. to Act
Bill Haskell writes Families Struggle Paying for Child Care While Working
Joel Eissenberg writes Time for Senate Dems to stand up against Trump/Musk
Signs and portents of an employment slowdown and a near-term recession
– by New Deal democrat
I continue to believe that a recession – possibly a deep if relatively brief one – is likely to start early next year. As I’ve mentioned before, this isn’t just an academic exercise; recessions by definition feature jobs and income losses, which is my primary interest.
With that introduction, let’s look at one overall metric, and several which will be updated tomorrow as part of the September jobs report.
First of all, if there were such a thing (ex- pandemic lockdowns) as a one quarter recession, courtesy of last week’s income revisions we almost certainly had one during Q2. Here’s a graph of most of the metrics relied upon by the NBER in dating recessions, plus several variations. Note that almost all of them went down during the April-June period – and I haven’t even included GDP:
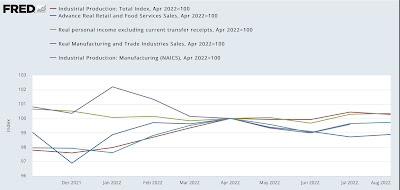
The only recession-related metrics that improved during Q2 were nonfarm payrolls and the mining and utilities portions of industrial production. Manufacturing production, income ex-government transfers, real retail sales, real manufacturing and trade sales, as well as real GDP, all declined during the second quarter. In the first two months of Q3, all of them improved from their June levels, and I expect that to continue in September.
Next, as I have said many times, consumption leads employment. Here’s the YoY% look at real retail sales (blue), real personal spending (black), vs. nonfarm payrolls (red). Because spending is more variable than jobs, note that both sales and spending metrics are reduced for scale:
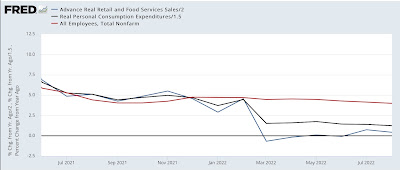
As I wrote the other day, real sales are flat YoY. Real spending is up less than 1% YoY. As a result, we should expect gains in nonfarm payrolls to decelerate to virtually nothing in the coming months.
Here’s a more granular look a the month over month change in each for the past 15 months:
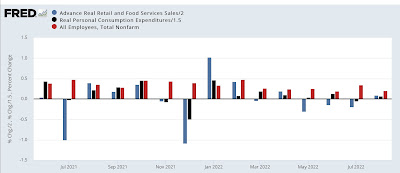
Note the outright slight decline in sales since February, and the sharp deceleration in spending. Job gains have been slowly decelerating since, and because consumption leads employment, we should expect that to continue. While any month can be an outlier, the likelihood is that tomorrow’s report will show gains of less than 300,000 jobs for the month of September.
Next, initial jobless claims lead the unemployment rate. Here’s a graph of the 4 week average of new jobless claims through this morning’s report (right scale), compared with the unemployment rate (left):
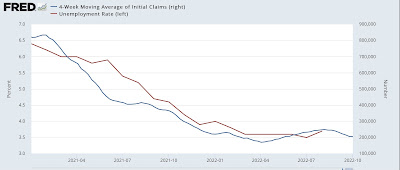
Last month the unemployment rate rose from its expansion low of 3.5% to 3.7%. While again any given month might be an outlier, I expect the unemployment rate to remain above 3.6% going forward in the next few months.
Finally, as I wrote last month, real aggregate payrolls of non-supervisory workers have an excellent record as a coincident to shortly leading indicator of recessions. Previously I showed YoY changes. Here are the quarter/quarter % changes for the past 60 years:
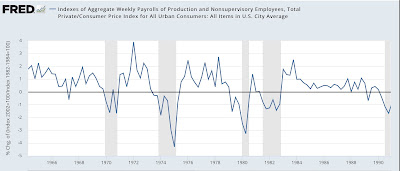
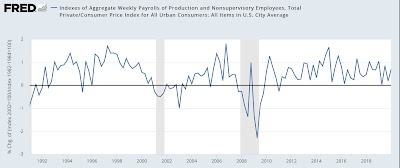
Occasionally there will be a single negative q/q change during slowdowns. The first negative q/q change has tended to happen 0-2 quarters before the onset of recessions during that period.
Now here is the close-up since the beginning of 2021, shown both quarterly through Q2 (blue) and monthly through August (red):
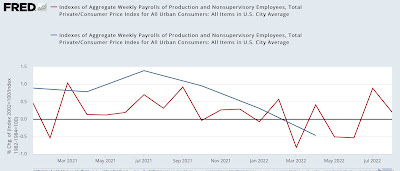
We’ve had two positive months so far in Q3. Tomorrow’s report, once adjusted for inflation, will complete the picture. Needless to say, a positive number will be good and a negative one bad.
Watching for a continued slowdown in jobs created, a continued slight elevation in unemployment over the bottom, the change in aggregate payrolls, plus whether wage gains for non-supervisory workers moderate, is my primary focus in tomorrow’s jobs report. Especially with OPEC having now joined the Fed in apparently trying to deliberately cause a recession.
