3 graphic signs of financial stress – by New Deal democrat The theme of my weekly “high frequency” economic indicators update over the weekend was the sudden deterioration in some measurements of financial stress. Tomorrow we’ll find out that house prices as measured by both the FHFA and Case Shiller have decline further, and that increases are substantially lower than as measured by the CPI, and on Friday we’ll find out what two of the NBER’s important measurements: real personal income and spending, as well as real manufacturing and trade sales, are, but since today there’s no big news, let’s take a look at those financial stress indicators I mentioned above. First, the Leverage subindex of the Chicago Fed’s Financial Conditions Index
Topics:
NewDealdemocrat considers the following as important: Hot Topics, politics, US EConomics
This could be interesting, too:
Robert Skidelsky writes Lord Skidelsky to ask His Majesty’s Government what is their policy with regard to the Ukraine war following the new policy of the government of the United States of America.
NewDealdemocrat writes JOLTS revisions from Yesterday’s Report
Joel Eissenberg writes No Invading Allies Act
Ken Melvin writes A Developed Taste
3 graphic signs of financial stress
– by New Deal democrat
The theme of my weekly “high frequency” economic indicators update over the weekend was the sudden deterioration in some measurements of financial stress.
Tomorrow we’ll find out that house prices as measured by both the FHFA and Case Shiller have decline further, and that increases are substantially lower than as measured by the CPI, and on Friday we’ll find out what two of the NBER’s important measurements: real personal income and spending, as well as real manufacturing and trade sales, are, but since today there’s no big news, let’s take a look at those financial stress indicators I mentioned above.
First, the Leverage subindex of the Chicago Fed’s Financial Conditions Index got bigly revised last week (from gold to red in the graph below), to show that leverage is now more restrictive than at any times not shortly before or during recessions (compared with the YoY change in the Fed funds rate, blue, for comparison):

This tells us that credit has actually been pretty tight for the last year, and especially the past few months.
Second, the St. Louis Fed’s Financial Stress index, which had been below zero, i.e., un-stressful as late as one week prior, suddenly shot up to levels not seen outside the last several recessions (see sliver at far right), except for the Long Term Capital Management crisis of 1998:

Third, in the past two weeks 2.3% of all deposits have been withdrawn from smaller commercial banks:
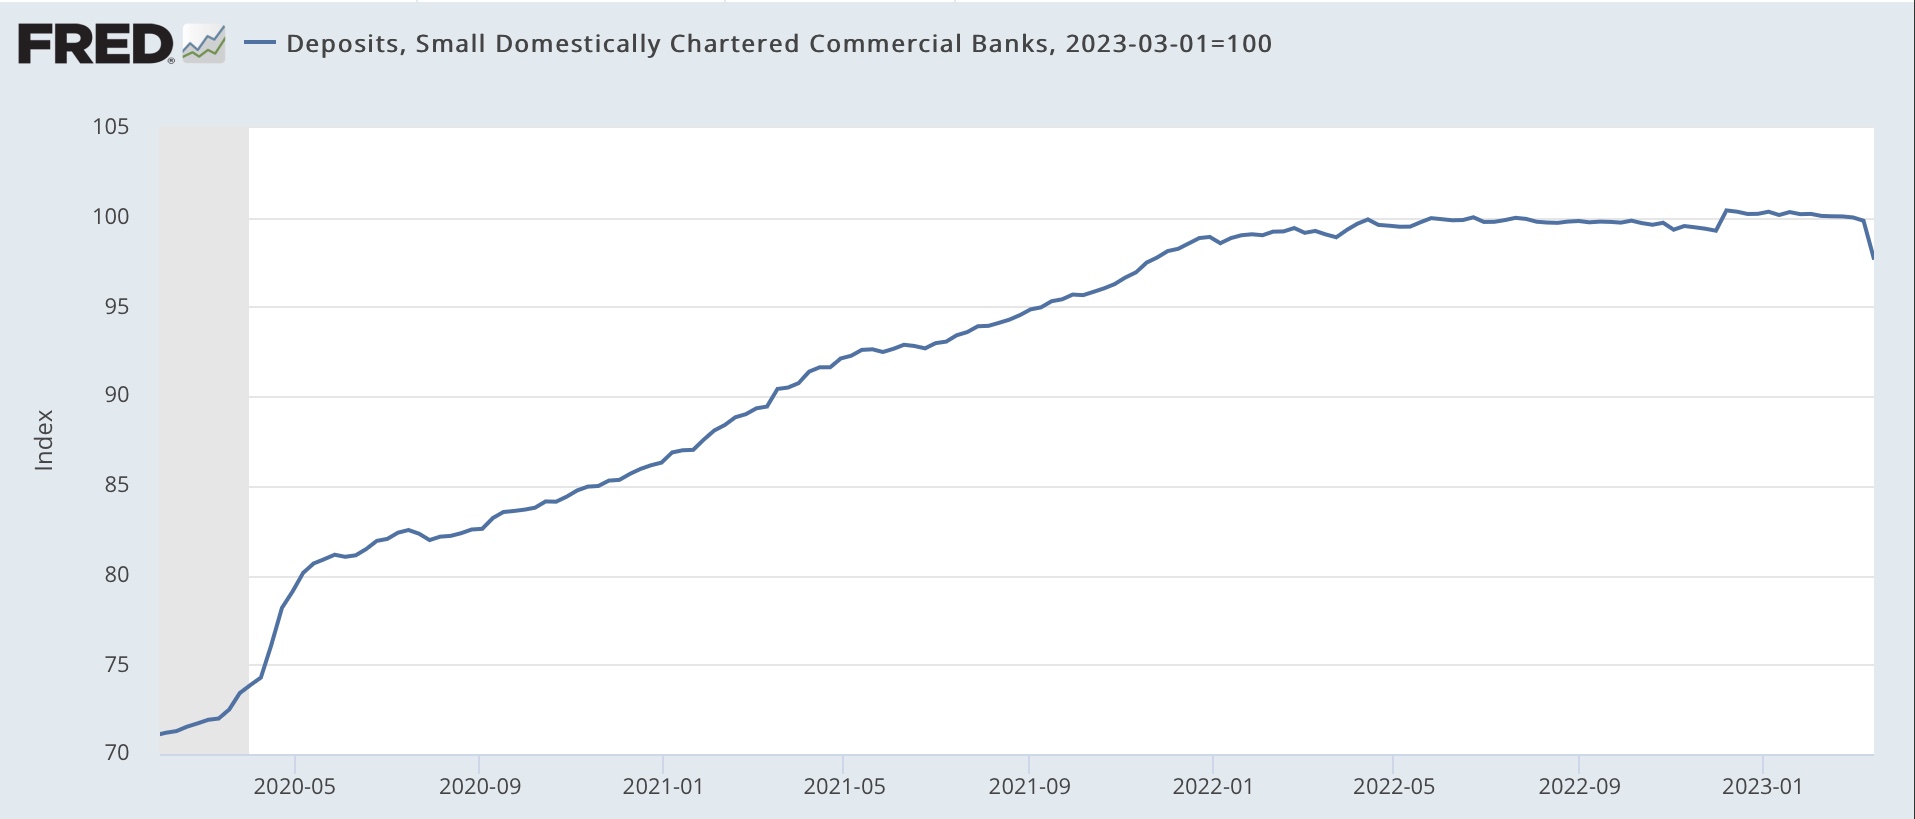
The only other time except for the past week that deposits YoY in commercial banks have been negative was in 1985-86:

If you have any significant money on deposit, whether in savings, checking, or money market accounts, you would do well to find out what the highest interest rate a bank in your area is paying for new money, and then march into your current bank and demand that they match that rate, or you will pull your money out. Especially if your bank has been piggish about continuing to pay almost non-existent interest, chances are very good you will get what you want.
It’s getting harder and harder to find any signs outside of employment that are not flashing warning signs of recession in the immediate future, if not already here.