Average and aggregate nonsupervisory wages for February 2023 – by New Deal democrat There’s no significant economic news today, so let’s update a couple of income indicators important to average American working households. Namely, because we now have the inflation report for February as well as payrolls, we can update average and aggregate nonsupervisory wages. Average hourly earnings for nonsupervisory employees increased 0.5% on a nominal basis in February, tied for the strongest reading since last June. But since consumer prices increased 0.4%, real average hourly wages only increased 0.1%: The good news, as indicated above, is that this is tied for the highest reading since last April (as I’ve noted many times, a decline in gas
Topics:
NewDealdemocrat considers the following as important: Average Wages, Hot Topics, US EConomics
This could be interesting, too:
NewDealdemocrat writes JOLTS revisions from Yesterday’s Report
Joel Eissenberg writes No Invading Allies Act
Bill Haskell writes The North American Automobile Industry Waits for Trump and the Gov. to Act
Bill Haskell writes Families Struggle Paying for Child Care While Working
Average and aggregate nonsupervisory wages for February 2023
– by New Deal democrat
There’s no significant economic news today, so let’s update a couple of income indicators important to average American working households. Namely, because we now have the inflation report for February as well as payrolls, we can update average and aggregate nonsupervisory wages.
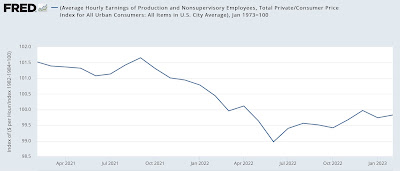
Average hourly earnings for nonsupervisory employees increased 0.5% on a nominal basis in February, tied for the strongest reading since last June. But since consumer prices increased 0.4%, real average hourly wages only increased 0.1%:

The good news, as indicated above, is that this is tied for the highest reading since last April (as I’ve noted many times, a $2 decline in gas prices can do wonders for economic statistics). The not so good news is that the above graph is normed to 100 as of January 1973, the record high water mark for nonsupervisory wages prior to the pandemic. Which means that we remain below that level, as we have been for almost a year.
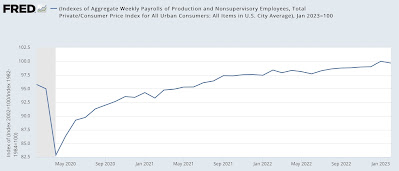
Second, aggregate real nonsupervisory payrolls are an excellent way of viewing the health of the American middle/working class as a whole. Nominal aggregate wages were unchanged in February, but in real terms declined -0.3% in February from January’s record high:

Typically real aggregate payroll growth slows down sharply in advance of recessions, and usually stalls out during recessions. In fact, YoY negative growth is a very good “fundamentals” mark of recession, because when average American households have less money to spend in the aggregate, they cut back. And a cutback in consumption leads to a cutback in jobs.
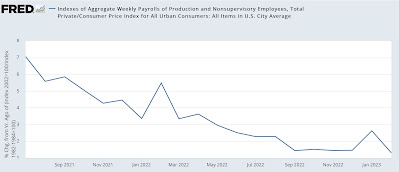
And the YoY trend in real aggregate payrolls, while not negative, has declerated sharply in the past year, and is currently at 1.4%:

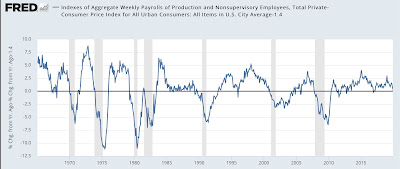
In the below long term graph, I subtract 1.4% from YoY growth so that it shows at the zero line:

As you can see, this level is consistent with a sharp slowdown (e.g., 1967, 1994, 2016) as well as an oncoming recession. *If* consumer inflation continues to ebb, then to indicate a recession, aggregate payrolls will have to decelerate faster than they have so far.
Real average wages and aggregate payrolls for nonsupervisory workers through January, Angry Bear, New Deal democrat
