Properly measured, consumer prices have been in *deflation* since last June – by New Deal democrat The majority wisdom is that the Fed is going to go ahead and raise interest rates again when it meets next week. I have been arguing for months that the data has not supported interest rate hikes. As of this morning, I am officially taking the position that, properly measured, inflation has been conquered, and the US economy has actually had price *declines* since last June. The reason, as I have been pounding on for over a year, is that the shelter component of official inflation, which is 1/3rd of the total, and 40% of the “core” measure, badly lags the real data – as in, by a year or more. So let’s start with an updated YoY graph of the
Topics:
NewDealdemocrat considers the following as important: Consumer Proces in Deflation, Hot Topics, politics, US EConomics
This could be interesting, too:
Robert Skidelsky writes Lord Skidelsky to ask His Majesty’s Government what is their policy with regard to the Ukraine war following the new policy of the government of the United States of America.
NewDealdemocrat writes JOLTS revisions from Yesterday’s Report
Joel Eissenberg writes No Invading Allies Act
Ken Melvin writes A Developed Taste
Properly measured, consumer prices have been in *deflation* since last June
– by New Deal democrat
The majority wisdom is that the Fed is going to go ahead and raise interest rates again when it meets next week. I have been arguing for months that the data has not supported interest rate hikes. As of this morning, I am officially taking the position that, properly measured, inflation has been conquered, and the US economy has actually had price *declines* since last June.
The reason, as I have been pounding on for over a year, is that the shelter component of official inflation, which is 1/3rd of the total, and 40% of the “core” measure, badly lags the real data – as in, by a year or more. So let’s start with an updated YoY graph of the official measure of inflation, Owner’s Equivalent Rent, which increased another 0.7% in February, with the FHFA house price index (/2 for scale), which has been declining since last June through its last reading for December:
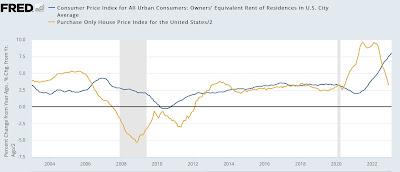
As I have repeated many time, house prices lead OER by 12 months or more. I said over a year ago that OER would drag core inflation in particular higher, even as actual house prices peaked. And that is exactly what has happened, as OER is now up 8.0% YoY, an all-time record, while the FHFA was only up 6.6% in December, and declining YoY at the rate of -1.6%/month:
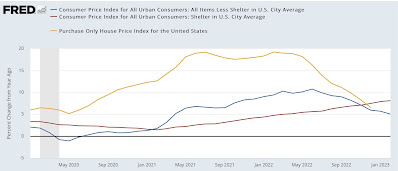
Note the above graph also shows CPI less shelter, which is up 5.0% YoY. If we were to project the recent declines in the FHFA index forward through February, it would be up only 3.4% YoY. Applying the 1/3rd weight of shelter, headline CPI is only up 4.5% YoY. That is if actual house prices rather than OER were in the calculation.
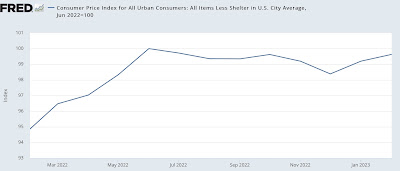
But that is not the most important point by any means. Because measured from last June, CPI less shelter is *down* -0.4%:
If we substitute the FHFA house price index for OER, headline CPI would have been down -1.4% as of December (since that is when the reported FHFA data ends):
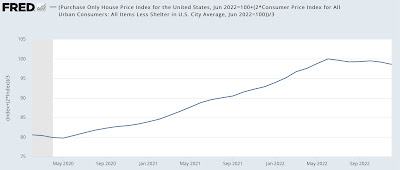
If the trend of FHFA price declines since last June is projected forward into February, those would be down -1.3%. In other words, if CPI used actual house prices rather than OER, since last June headline CPI would be *down* -0.7%. UPDATE: Here’s what YoY core inflation using the FHFA house price index rather than the official shelter measure looks like through December:
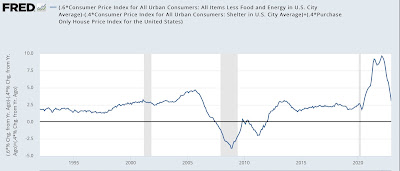
Because CPI for rent has accelerated since then, but house prices have likely continued to decline, there is every reason to believe that YoY core inflation using actual house prices is now below 3%.
Indeed, with “core” inflation only up 3.4% since last June:
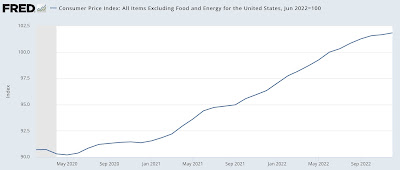
If we were to substitute house prices as measured by the FHFA (down at a projected trend through February of -1.2% since then) for OER, then even core CPI would be down -0.3% since then.
To repeat my main point: properly measured – certainly for purposes of Fed action – consumer prices in the US since last June have actually been in *deflation.* Further, there is every reason to believe that by the end of this spring, even YoY CPI, properly measured, would be no higher than 3.0% – within the Fed’s comfort zone.
Before I conclude, let me briefly note 3 other sectors.
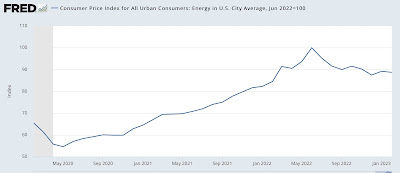
First, now that oil and gas prices have stabilized, gas prices no longer made a big impact one way or the other on CPI. But because fuel oil declined a big 7.0% in February, CPI for energy as a whole declined -0.6%. YoY energy prices are up 5.0%, but since last June’s peak are down -11.3%:
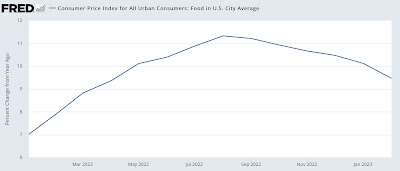
Another hot spot for inflation has been food prices. That is decelerating, if not entirely abating, as well. Food prices increased 0.4% in February, the smallest increase since April 2021:
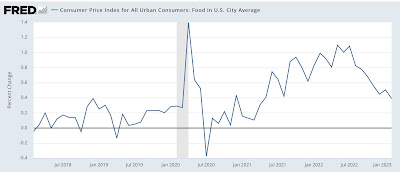
YoY food prices remain up 9.5%:
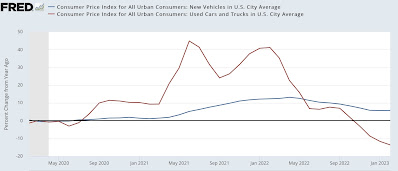
Finally, new and used vehicle prices, another hot spot, are also generally moving in the right direction. The price of new vehicles increased 0.3% in February, while used vehicles declined -2.8%. Thus YoY new vehicle prices are up 5.8%, while used vehicles are down -13.6%:
To summarize: outside of the official measure of shelter, the only significant sector to show a price increase of more than 0.3% was food. Both headline and core inflation are only up outside of the Fed’s comfort zone because of the way shelter prices are calculated.
But whether or now OER “should” be used to calculate CPI, it most certainly should *not* be used by the Fed to determine monetary policy. When properly measured, there has actually been *deflation* of both the headline and core measures since last June, and even on a YoY basis inflation is very likely to be within the Fed’s comfort zone in several months.
Consumer prices rise 1% in May alone; owners’ equivalent rent at 30 year high, Angry Bear, New Deal democrat.
