Coronavirus dashboard: the first year of COVID endemicity – by New Deal democrat As I indicated back in January, I don’t plan on any regular COVID dashboard updates unless something noteworthy has occurred. Since we are now 1 year into endemicity, this is a good time to look back and see what that means. The huge initial Omicron spike started in late November 2021 and ended early in March 2022. Since March 1 of 2022, here is the range of confirmed cases daily: Confirmed cases have varied between a low of 27,400 last April 3 to a high of 140,000 on July 17. The winter Holiday wave only reached a peak of 76,800. As of yesterday, cases were 37,000. But with the advent of home testing over a year ago, fewer and fewer people are having
Topics:
NewDealdemocrat considers the following as important: COVID-19, Education, Healthcare, Hot Topics
This could be interesting, too:
NewDealdemocrat writes JOLTS revisions from Yesterday’s Report
Joel Eissenberg writes No Invading Allies Act
Bill Haskell writes Families Struggle Paying for Child Care While Working
NewDealdemocrat writes January JOLTS report: monthly increases, but significant downward revisions to 2024
Coronavirus dashboard: the first year of COVID endemicity
– by New Deal democrat
As I indicated back in January, I don’t plan on any regular COVID dashboard updates unless something noteworthy has occurred. Since we are now 1 year into endemicity, this is a good time to look back and see what that means.
The huge initial Omicron spike started in late November 2021 and ended early in March 2022. Since March 1 of 2022, here is the range of confirmed cases daily:
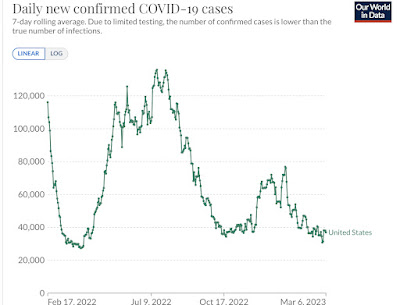
Confirmed cases have varied between a low of 27,400 last April 3 to a high of 140,000 on July 17. The winter Holiday wave only reached a peak of 76,800. As of yesterday, cases were 37,000.
But with the advent of home testing over a year ago, fewer and fewer people are having the “official” tests to confirm their cases. To get a more accurate reading, Biobot’s waste particles analysis is the better metric (dotted line = 2,000 copes per mL):
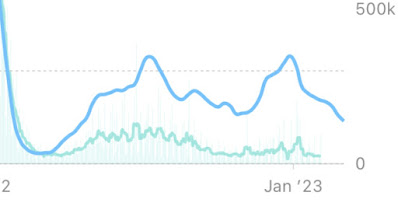
At the peak of the Omicron wave, Biobot measured 4,553 particles per milliliter. By contrast, the lowest number was 40 per milliliter on May 26, 2021, at the point where we thought the initial round of vaccinations might conquer the virus.
Since March 1, 2022, particles have varied from a low of 110 particles on March 9, 2022 to a peak of 1,160 on December 28, with a close secondary peak of 1,140 on July 20. The most recent reading last week on March 1 was 460, even lower than last October’s 536. This suggests that the “real” number of daily cases has varied from about a low of 75,000 to a high of 600,000 during the Holidays.
That cases have been as high as they are is probably a combination of the nearly total abandonment of mitigation measures, plus the fact that each new variant has been indicated as inherently more immune-evasive than the last. Thus BA-1 was superseded by the even more transmissible BA-2, then the ever more transmissible BA-2.12.1, BA-5, and finally XBB.1.5, which according to the CDC is so dominant that as of last week it accounted for over 90% of all cases:
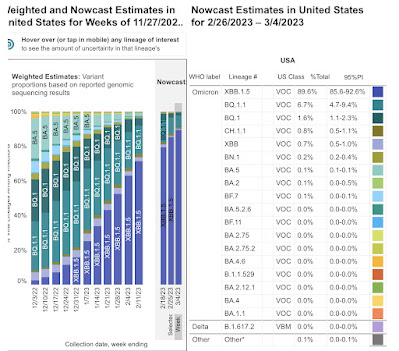
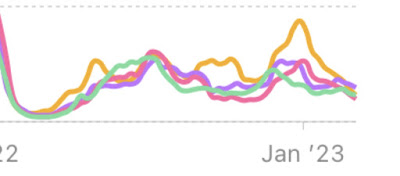
Regionally XBB varies from a “low” of 75%+ in the Pacific Northwest to over 98% of all cases in the Northeast and Mid-Atlantic. In fact, XBB.1.5 has so thoroughly transmitted through the vulnerable portion of the population of the Northeast that that Census Region now has a lower particle count than at any point since last March (dotted line = 2,000 particles per mL; Northeast is gold, West green, South pink, and Midwest violet):
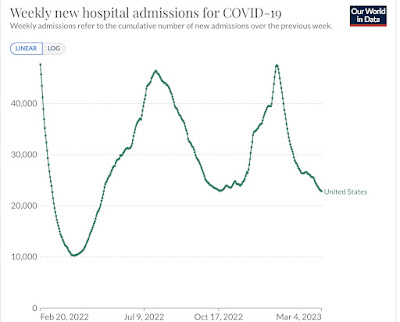
Advances in treatment, the percent of the population that has been vaccinated, and increased resistance from prior infections has meant that hospitalizations, which reached a peak of over 160,000 during the Omicron wave, have varied between just below 10,300 last April 5 to a peak of 47,500 this January 3, with a secondary peak of 46,400 last July 25. Currently hospitalizations are at a new 11 month low of 22,800, just below last October’s 22,900:
Which brings us, finally, to deaths, which during last March were still declining from their Omicron peak of 2600 per day in January 2022. Since then they have varied from a low of 234 at the end of November to a high of 642 in January:
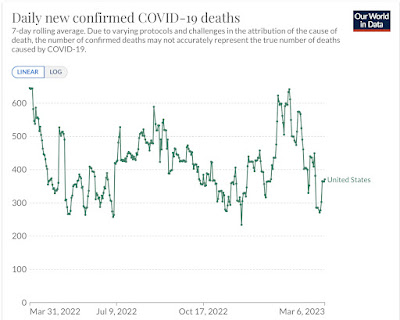
Currently deaths average 371 for the past week.
Deaths during each of the first two years of the pandemic totaled about 500,000. Since April 1 of last year, total deaths have increased by 139,000, for an annual rate of 150,000. While this is the equivalent of a very bad flu season, that masks the fact that vulnerability to dying from COVID is very much a factor of immunization status and age.
Here is the death rate by vaccination status for all age groups in total since the start of the pandemic:
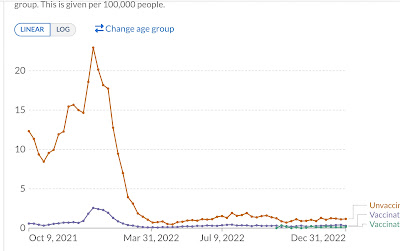
In general the unvaccinated are more than 10x as likely to die from COVID as are the unvaccinated.
But age is also a huge determinant. Here are the death rates by various age groups, broken down into vaccinated vs. unvaccinated.
Age 80+:
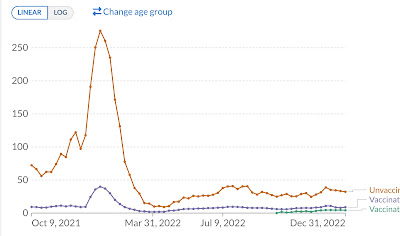
Age 65-79:
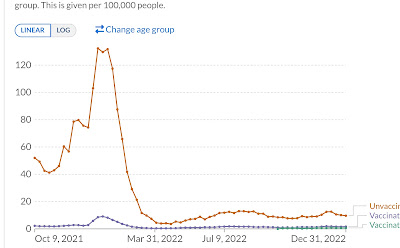
Age 50-64:
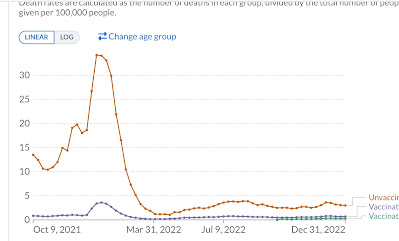
Age 30-49:
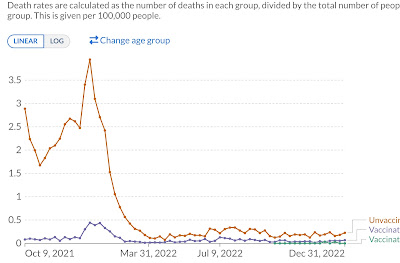
Age 18-29:
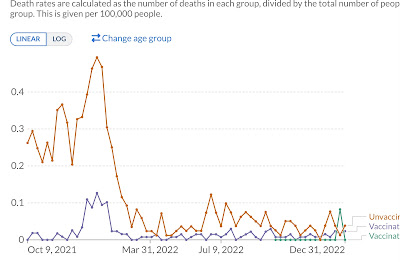
As you can see, regardless of vaccination status, risk rises steeply with age. A fully vaccinated senior is almost as likely to die of COVID as is an unvaccinated person age 50-64.
To summarize: in the first year of endemicity, case rates have averaged 1 person in 1000 each day, varying between a low of 1 in 4000 to a high of 1 in 500. Hospitalizations have ranged between roughly 10,000 to 50,000 per day (well below the crisis point of roughly 150,000 per day). Deaths have ranged between roughly 250 to 600 per day (vs. 1000 to 2600 during the first 2 years of the pandemic), heavily skewed towards the unvaccinated and the aged.
Finally, if we break down seniors between roughly 7 million unvaccinated and 57 million vaccinated, with about 75,000 of the former dying in the past 12 months and 30,000 of the latter, we get a death rate of 1 in 1000 for the unvaccinated and 1 in 20,000 for the vaccinated. Over the next 10 years, if that were to continue, unvaccinated seniors have a 1 in 100 likelihood of dying from COVID, while the unvaccinated have a 1 in 2000 likelihood for dying from the disease over that period.
