AB: IEA will not allow me to change any wording. Anything in italics or leads with an AB in front is my wording. I believe the following (charts and brief summation) to be a good explanation of where the US stands at far as changes in energy and usage. A little background concerning our home. We live in a mostly electricity using house in terms of energy usage. Our fans are driven by DC (inverters) electricity. We have a heat pump to supply heat and also air conditioning. Standard Bradford 50-gallon water heater. Natural Gas cook top and oven (these will eventually disappear). Foam insulation in the roof and 2×6 walls with more layered to the outside walls. When it was hitting 120 degrees on and off, our highest electric bill was 4 when many
Topics:
Bill Haskell considers the following as important: climate change, Education, electricity, IEA, US EConomics
This could be interesting, too:
NewDealdemocrat writes JOLTS revisions from Yesterday’s Report
Bill Haskell writes The North American Automobile Industry Waits for Trump and the Gov. to Act
Bill Haskell writes Families Struggle Paying for Child Care While Working
Joel Eissenberg writes Time for Senate Dems to stand up against Trump/Musk
AB: IEA will not allow me to change any wording. Anything in italics or leads with an AB in front is my wording. I believe the following (charts and brief summation) to be a good explanation of where the US stands at far as changes in energy and usage.
A little background concerning our home. We live in a mostly electricity using house in terms of energy usage. Our fans are driven by DC (inverters) electricity. We have a heat pump to supply heat and also air conditioning. Standard Bradford 50-gallon water heater. Natural Gas cook top and oven (these will eventually disappear). Foam insulation in the roof and 2×6 walls with more layered to the outside walls. When it was hitting 120 degrees on and off, our highest electric bill was $214 when many others for July were two to four times more. Inside temp was set at 76 degrees. In the morning now, I open the screened rear sliding insulated glass door and let the cold air into the house.
Complaint? Crappy uninsulated piping for hot and cold water.
If I was doing a presentation, I would be talking through most of the charts and graphs which I believe AB readers can grasp also.
IEA – United States Energy Policy Landscape 1990 – 2021
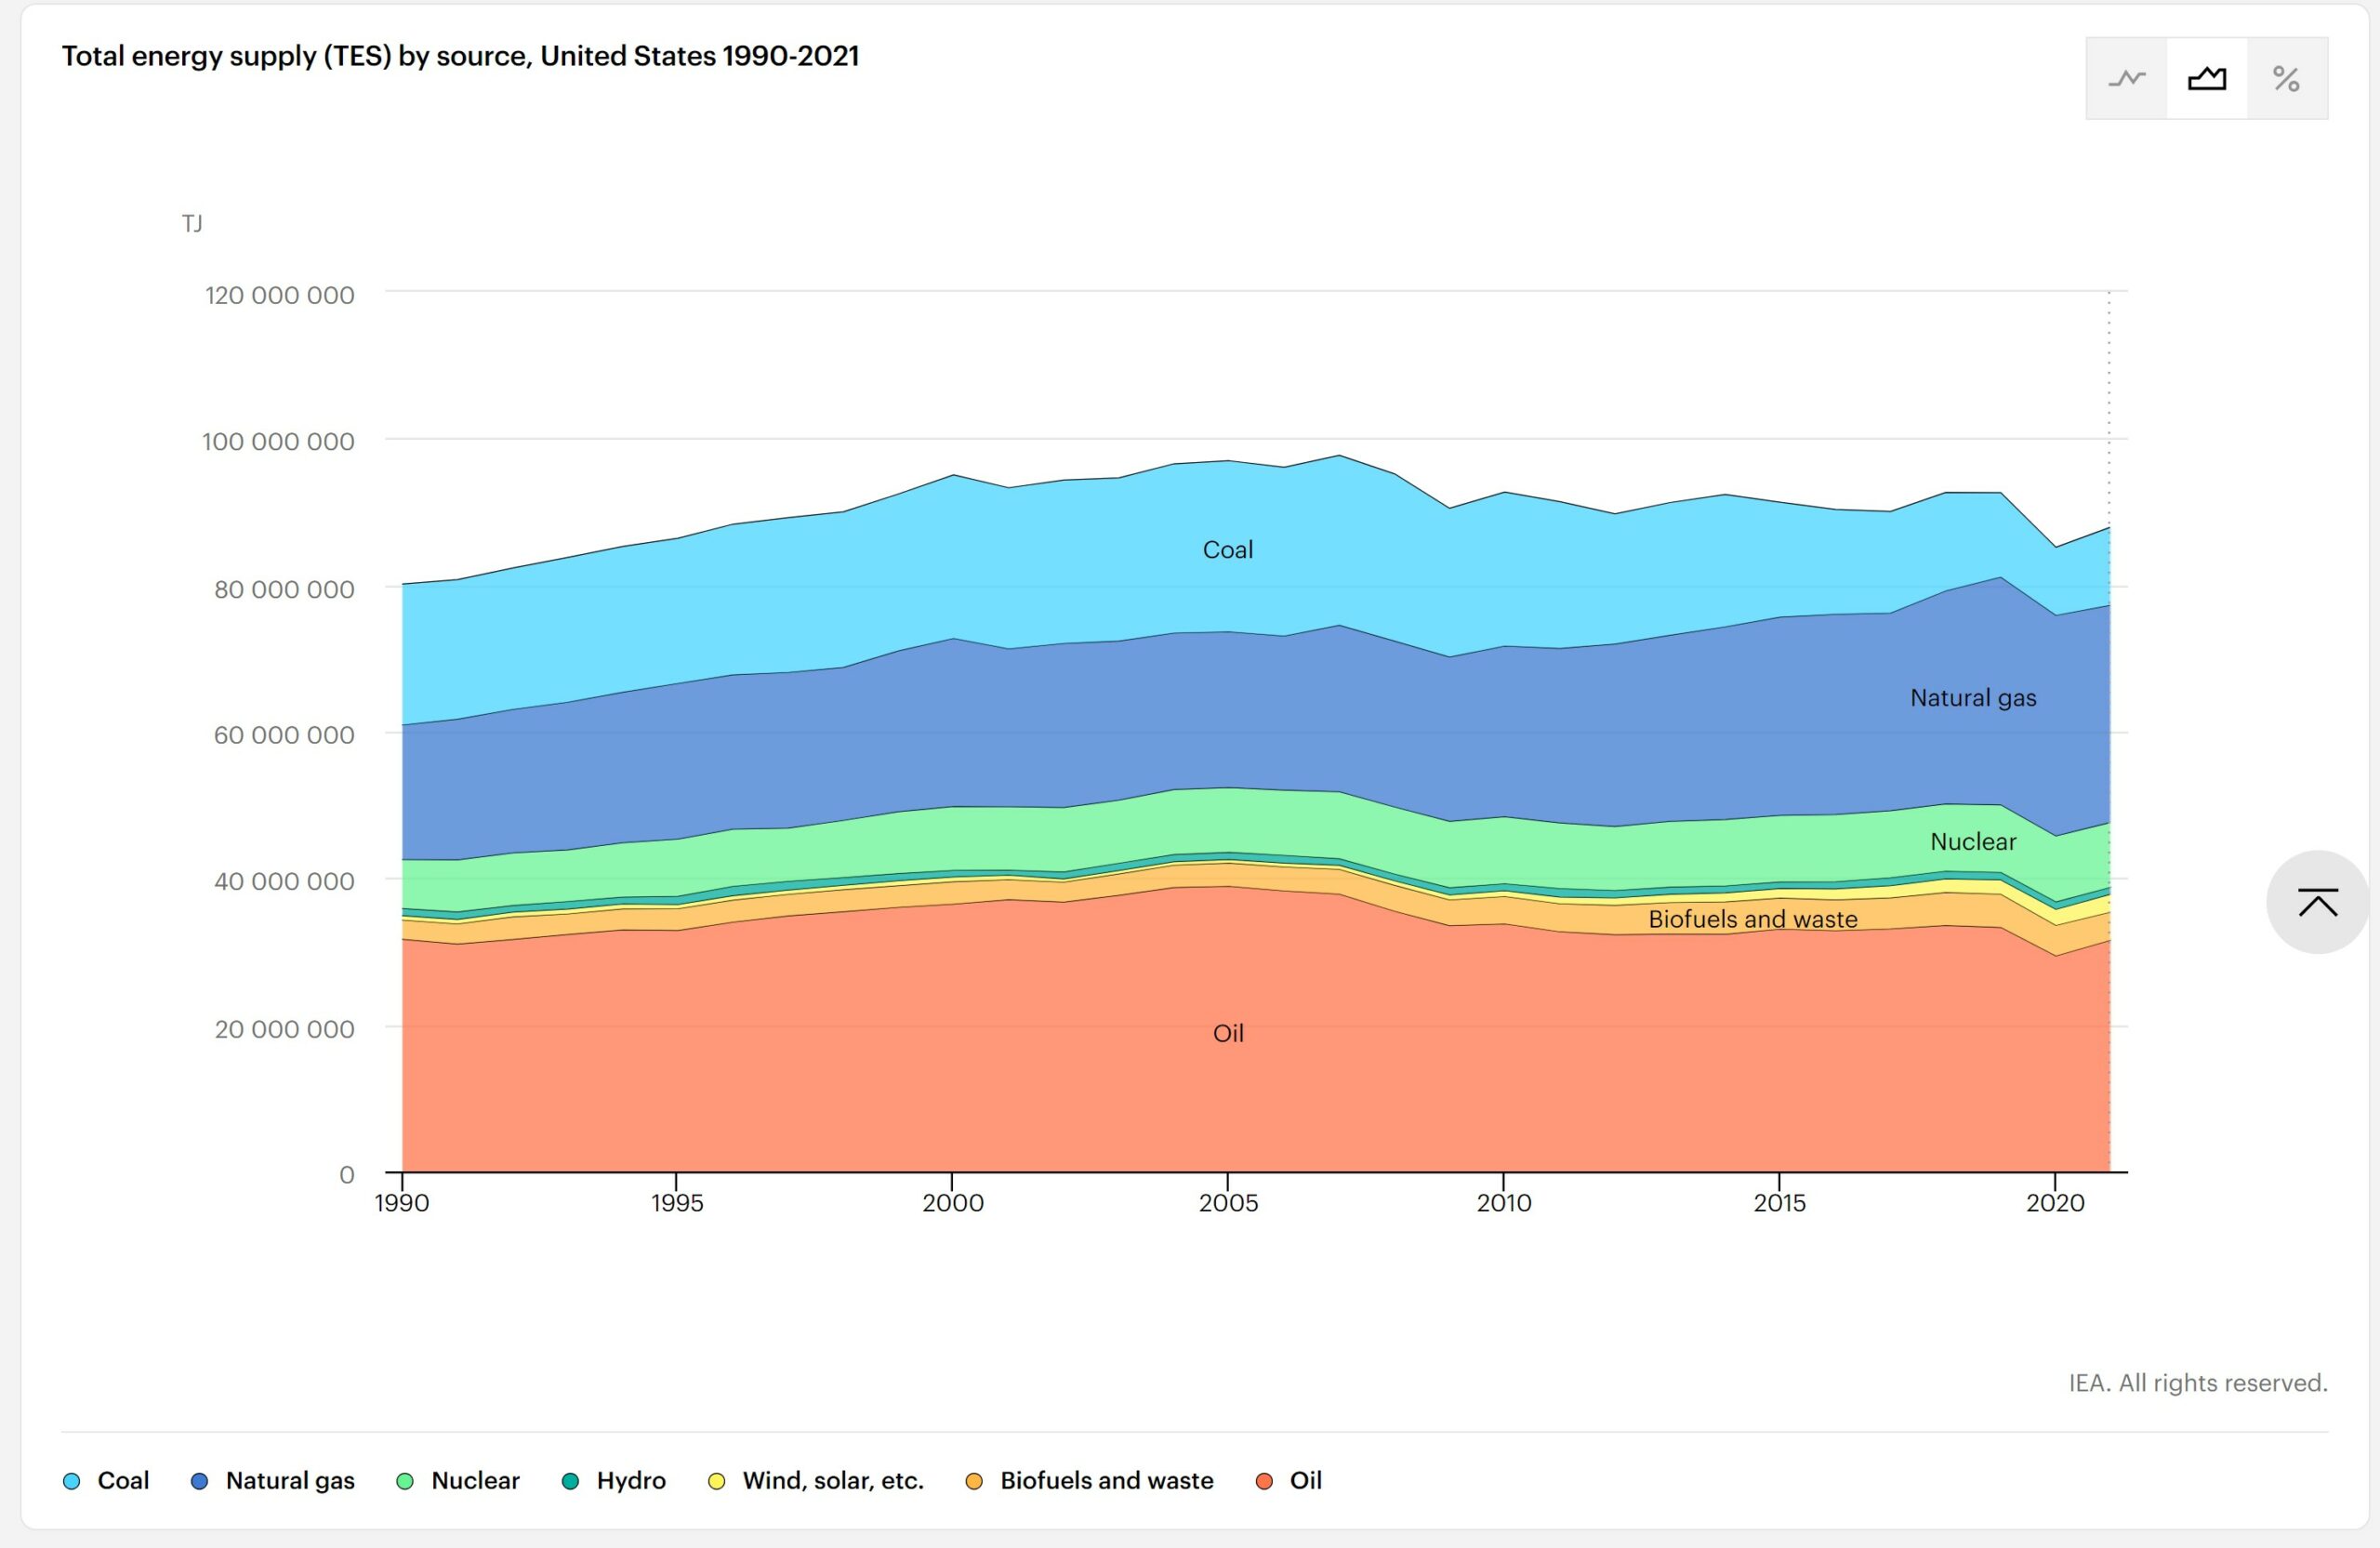
The energy policy landscape of the United States has fundamentally changed over the past decade. In many respects, the country is in a strong position to deliver a reliable, affordable and environmentally sustainable energy system.
Innovations in oil and gas extraction through horizontal drilling and hydraulic fracturing have made oil and gas production from shale formations a mainstay of the US and global energy landscape. The timely siting of supporting infrastructure will be essential to ensuring continued gains from the shale boom.
The fuel mix of US power generation is undergoing a considerable transition. Coal power has declined in the last decade as the shale gas boom made natural gas-fired generators more cost-competitive. Meanwhile, renewable electricity has seen rapid growth as well, driven by reduced costs and policy support, while nuclear is facing competitive threats. As the US power mix shifts and as more variable renewables are introduced into the system, the question of smoothly and cost-effectively connecting new generation sources to the grid will require more policy and regulatory responses in the coming years.
Energy security remains a priority issue for the United States. The country continues to demonstrate a strong focus on reliability and resilience, recognizing that its national and economic security depend on the reliable functioning of its energy infrastructure.
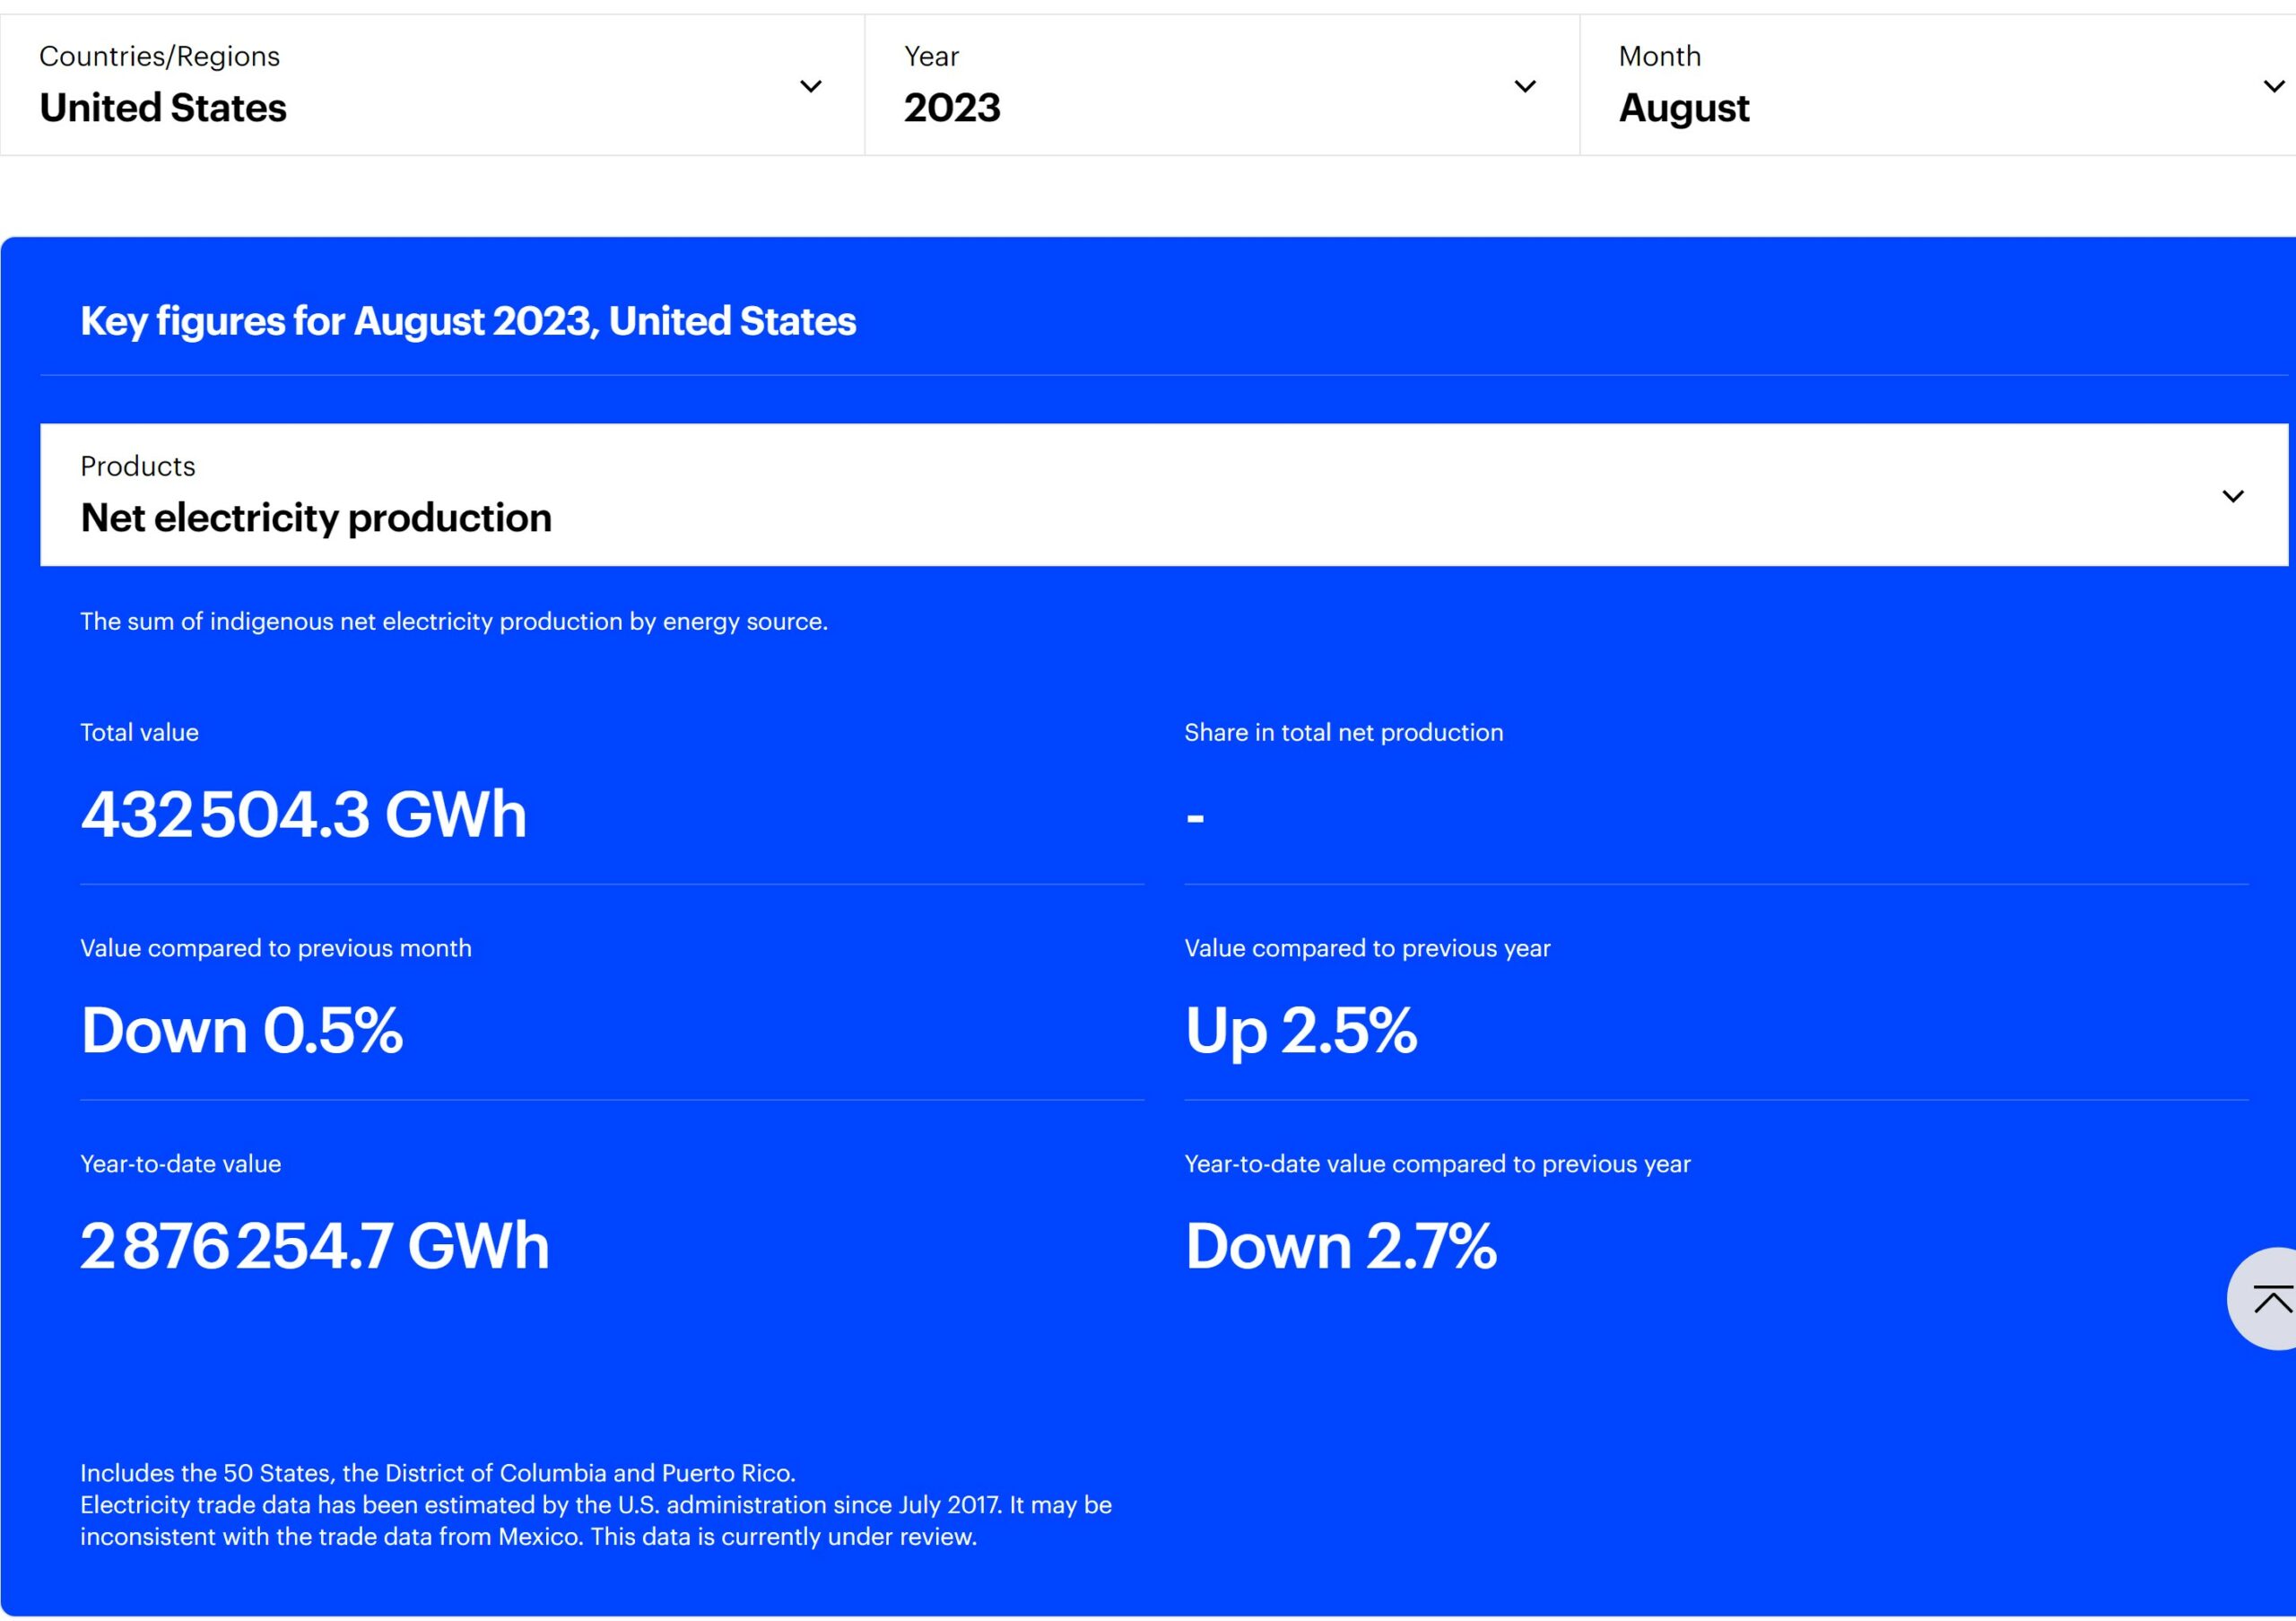
Key Figures for August 2023 – United States
Net Electricity Production
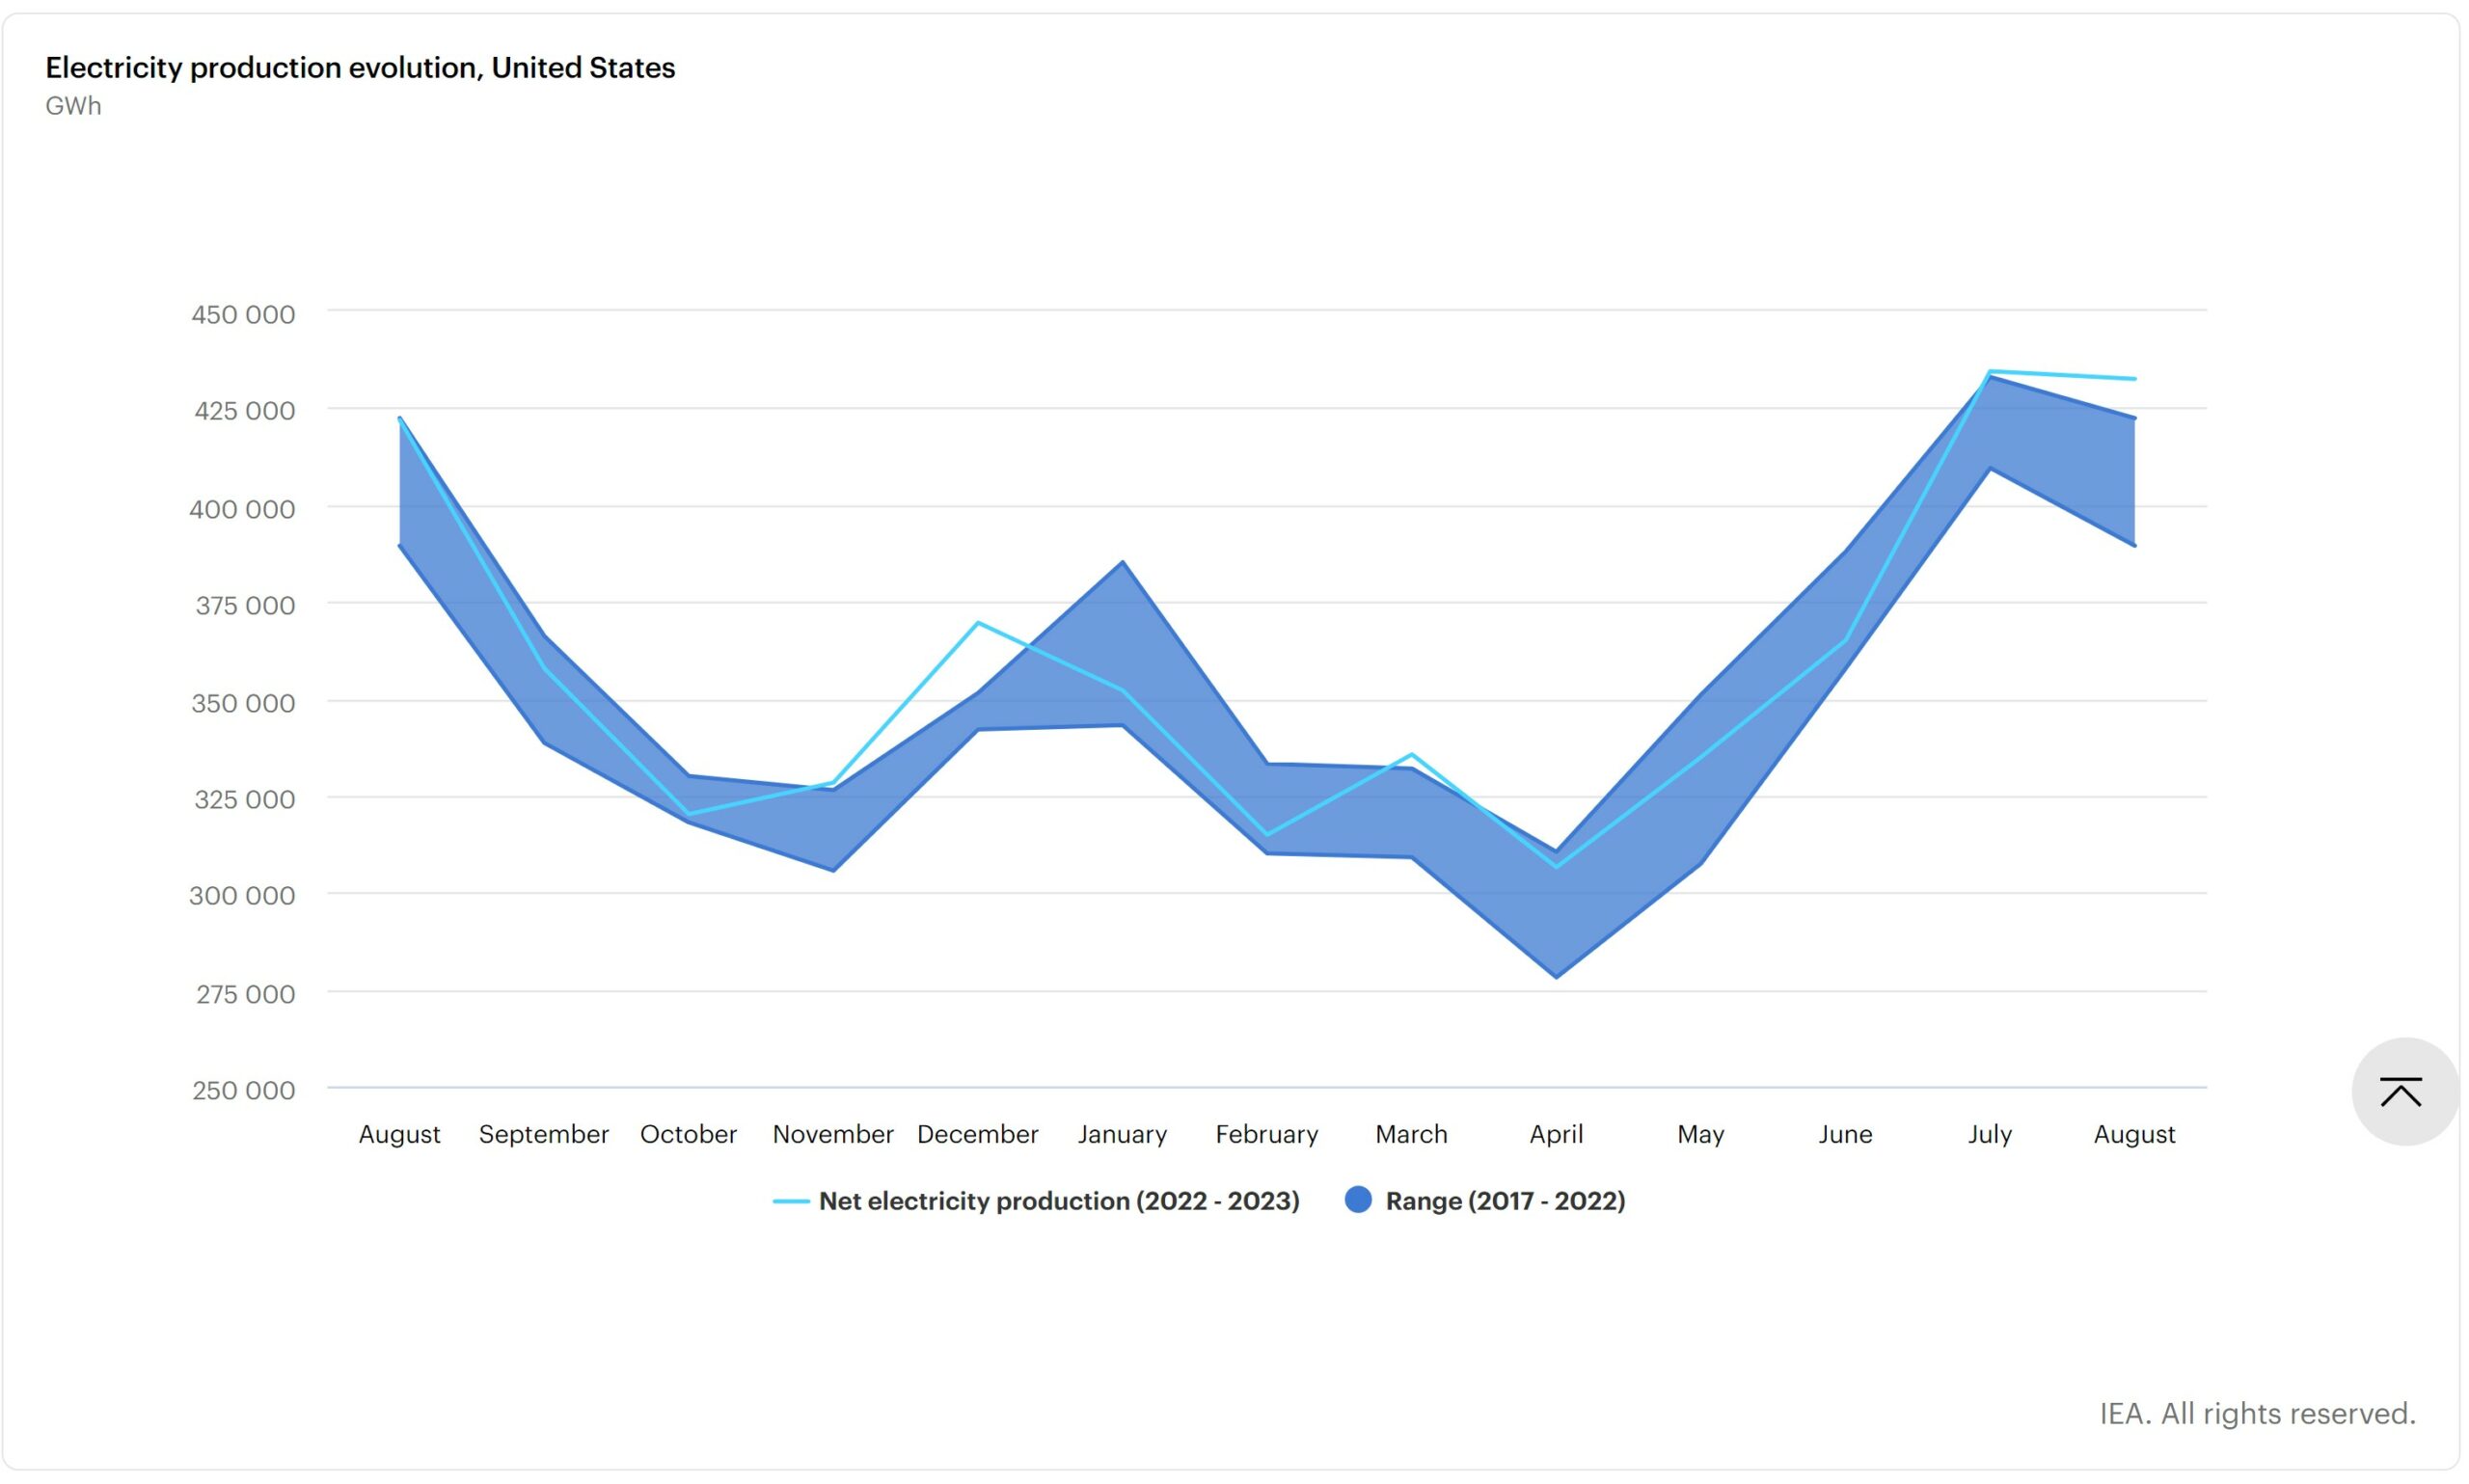
Electricity Production Evolution
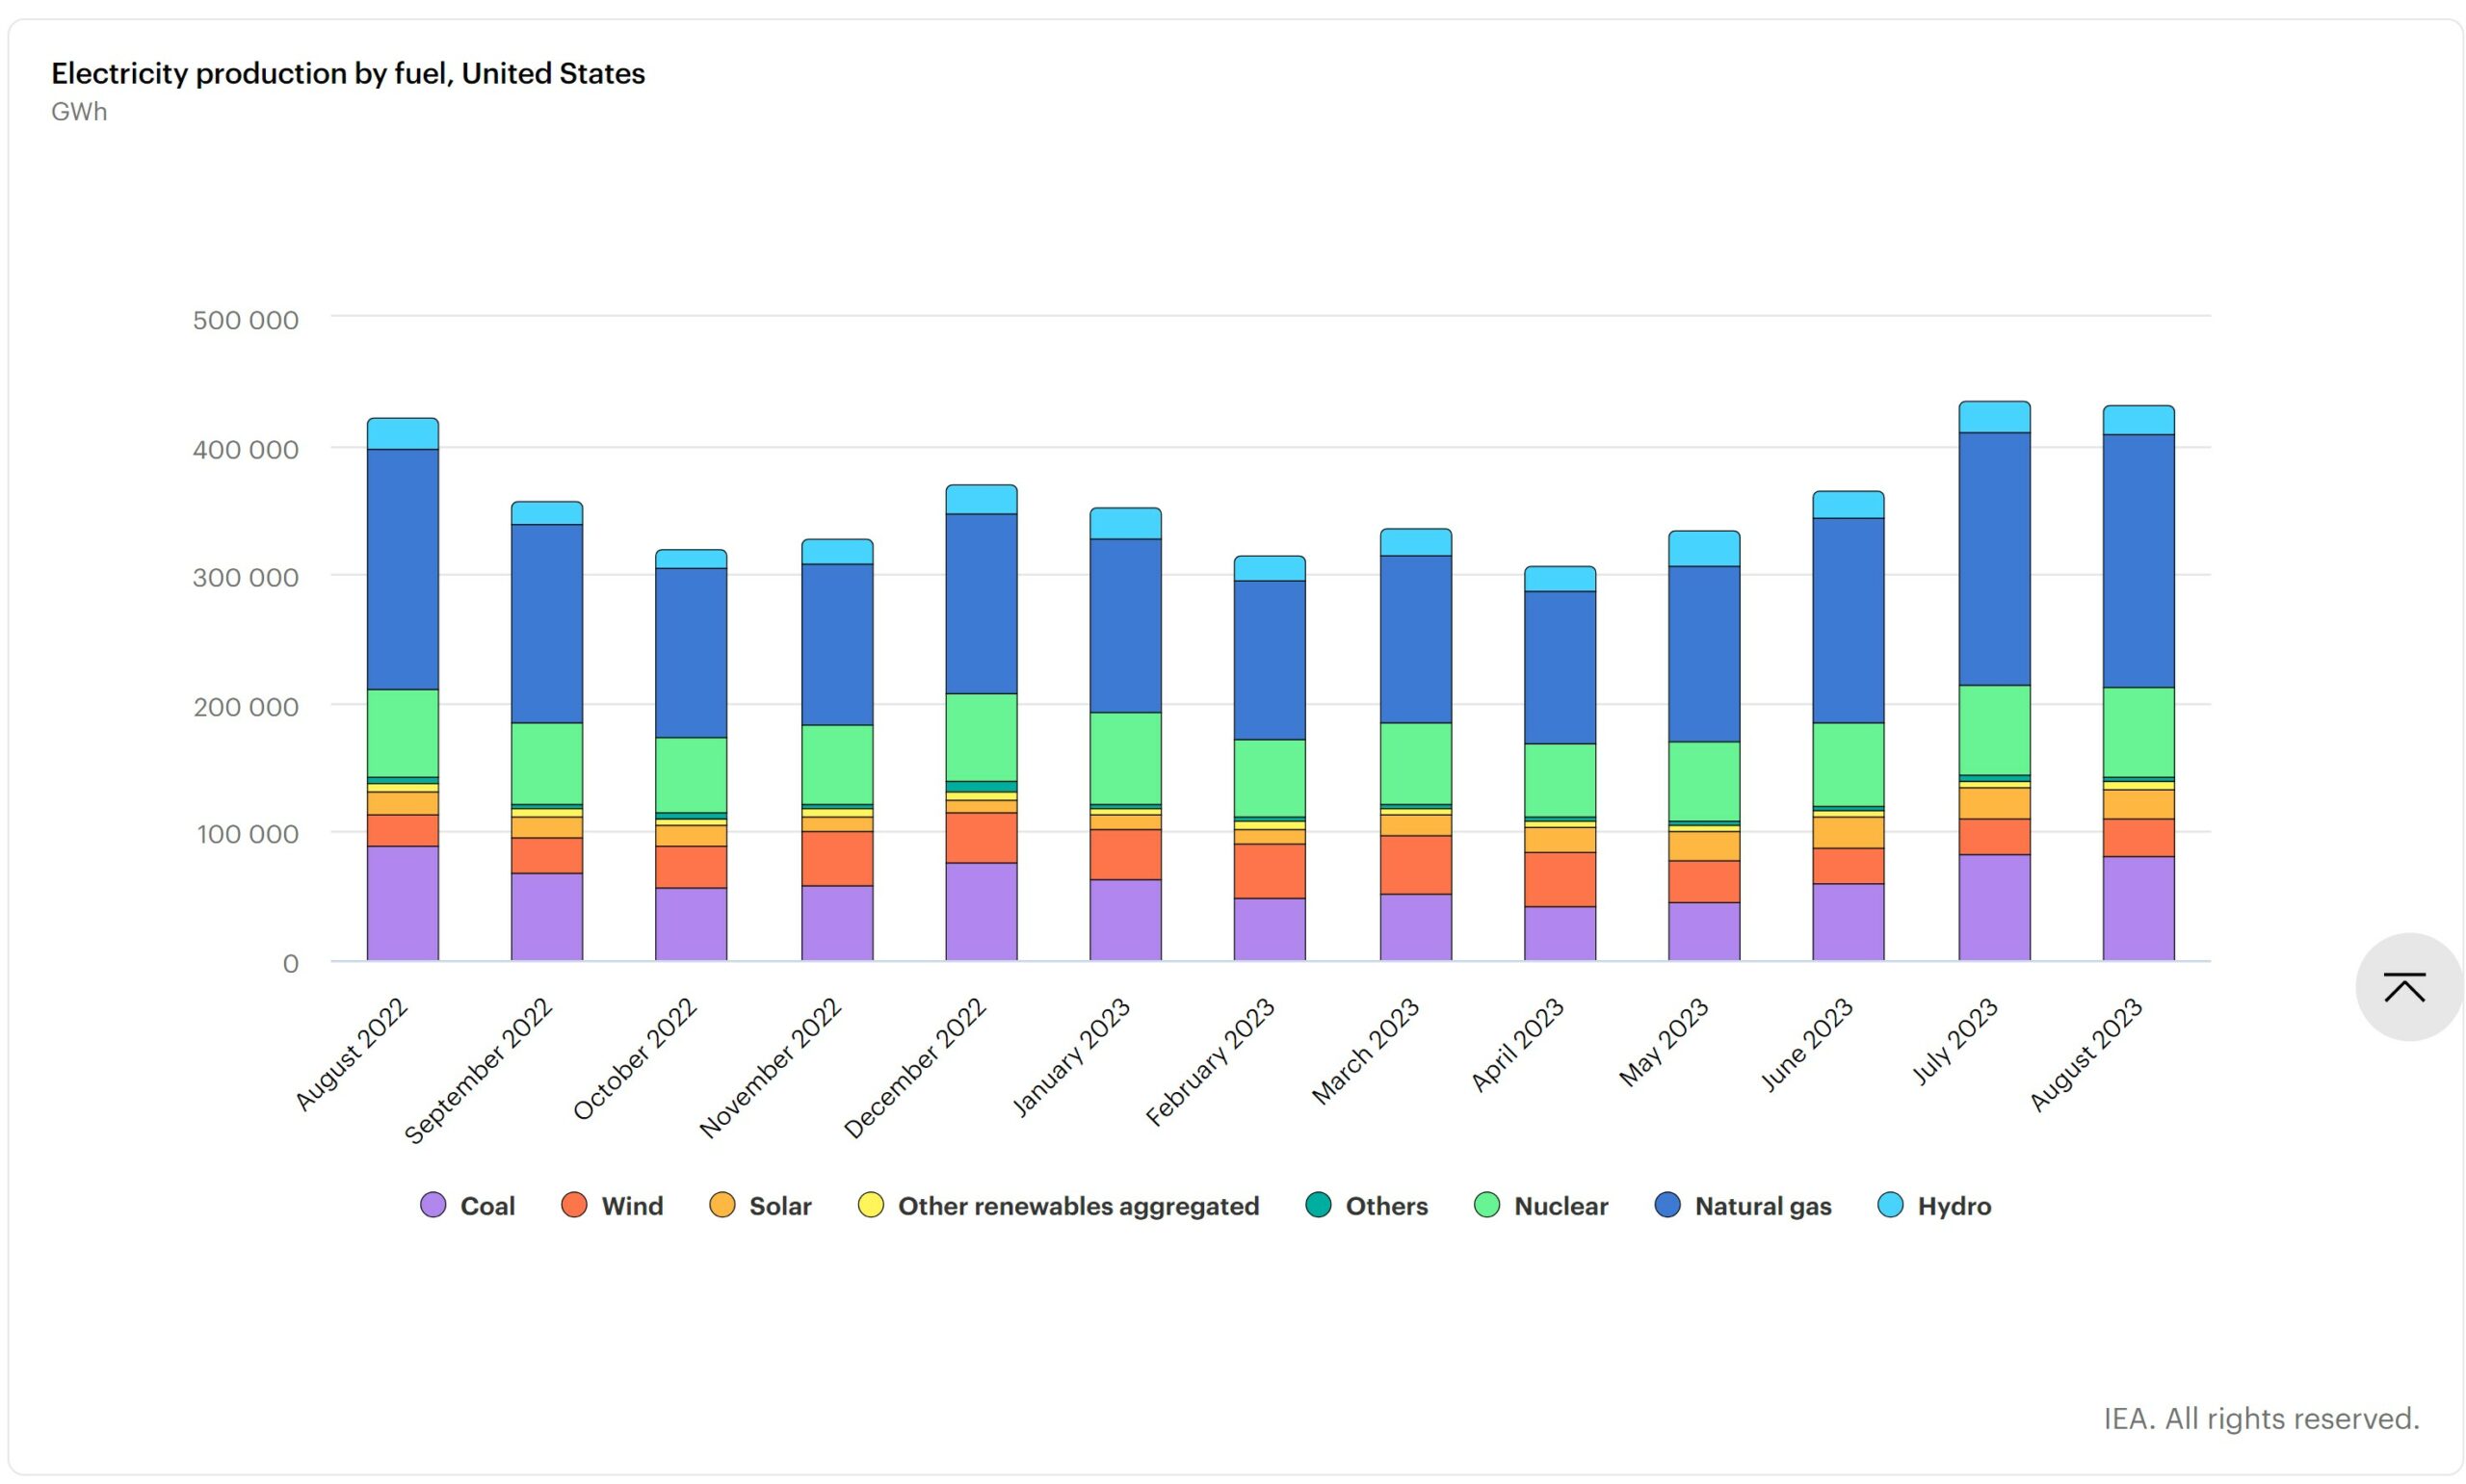
Electricity Production by Fuel
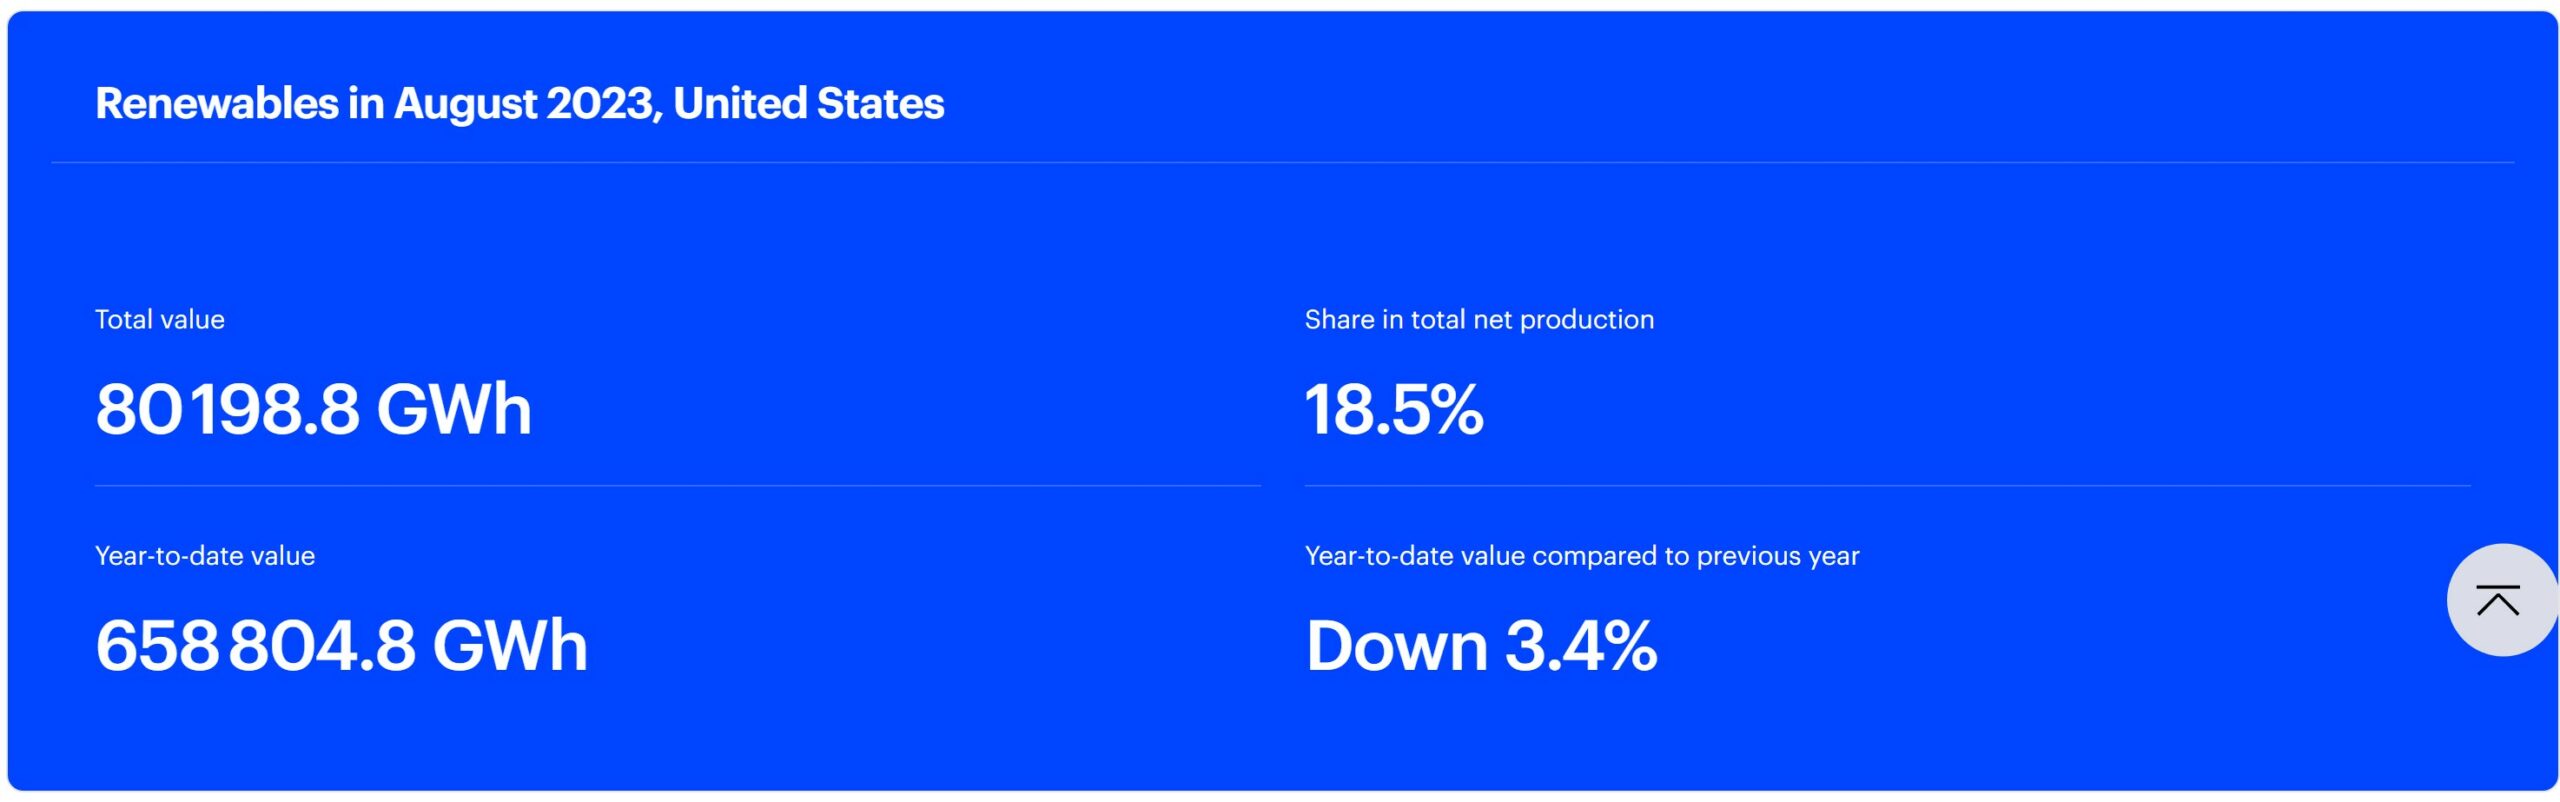
Renewables August 2023
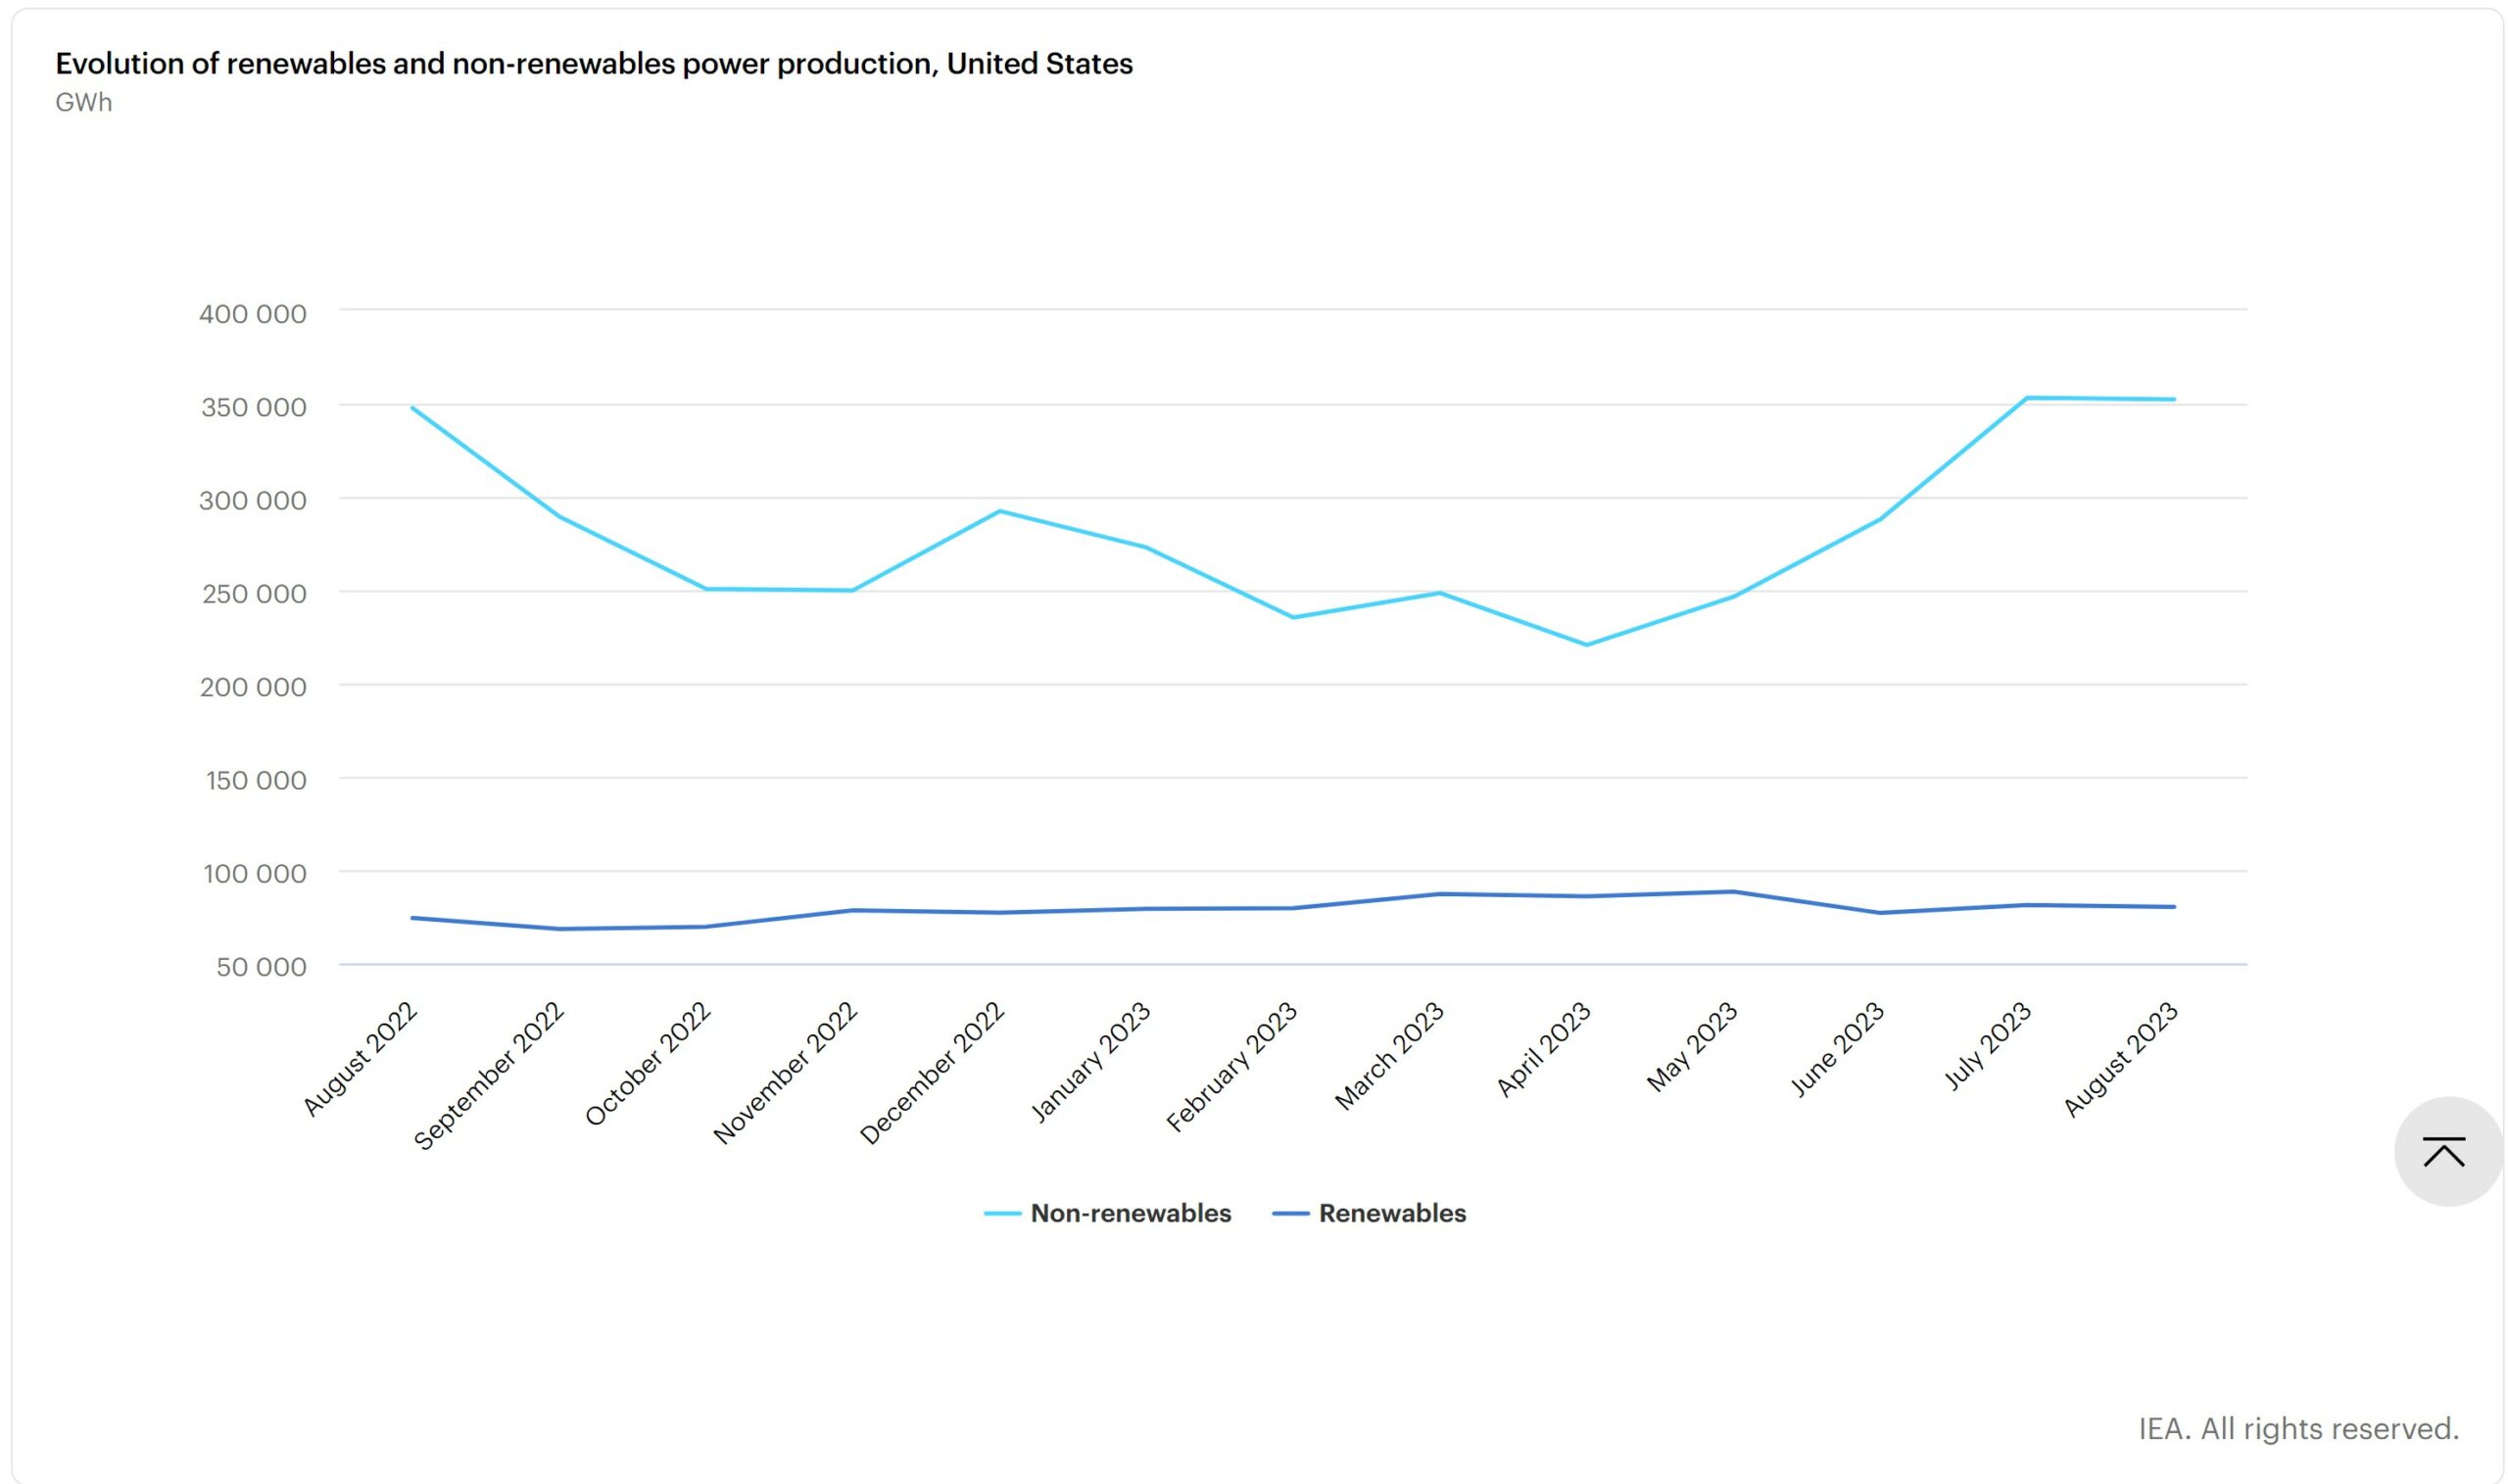
Evolution of Renewables and non-Renewables Power Production
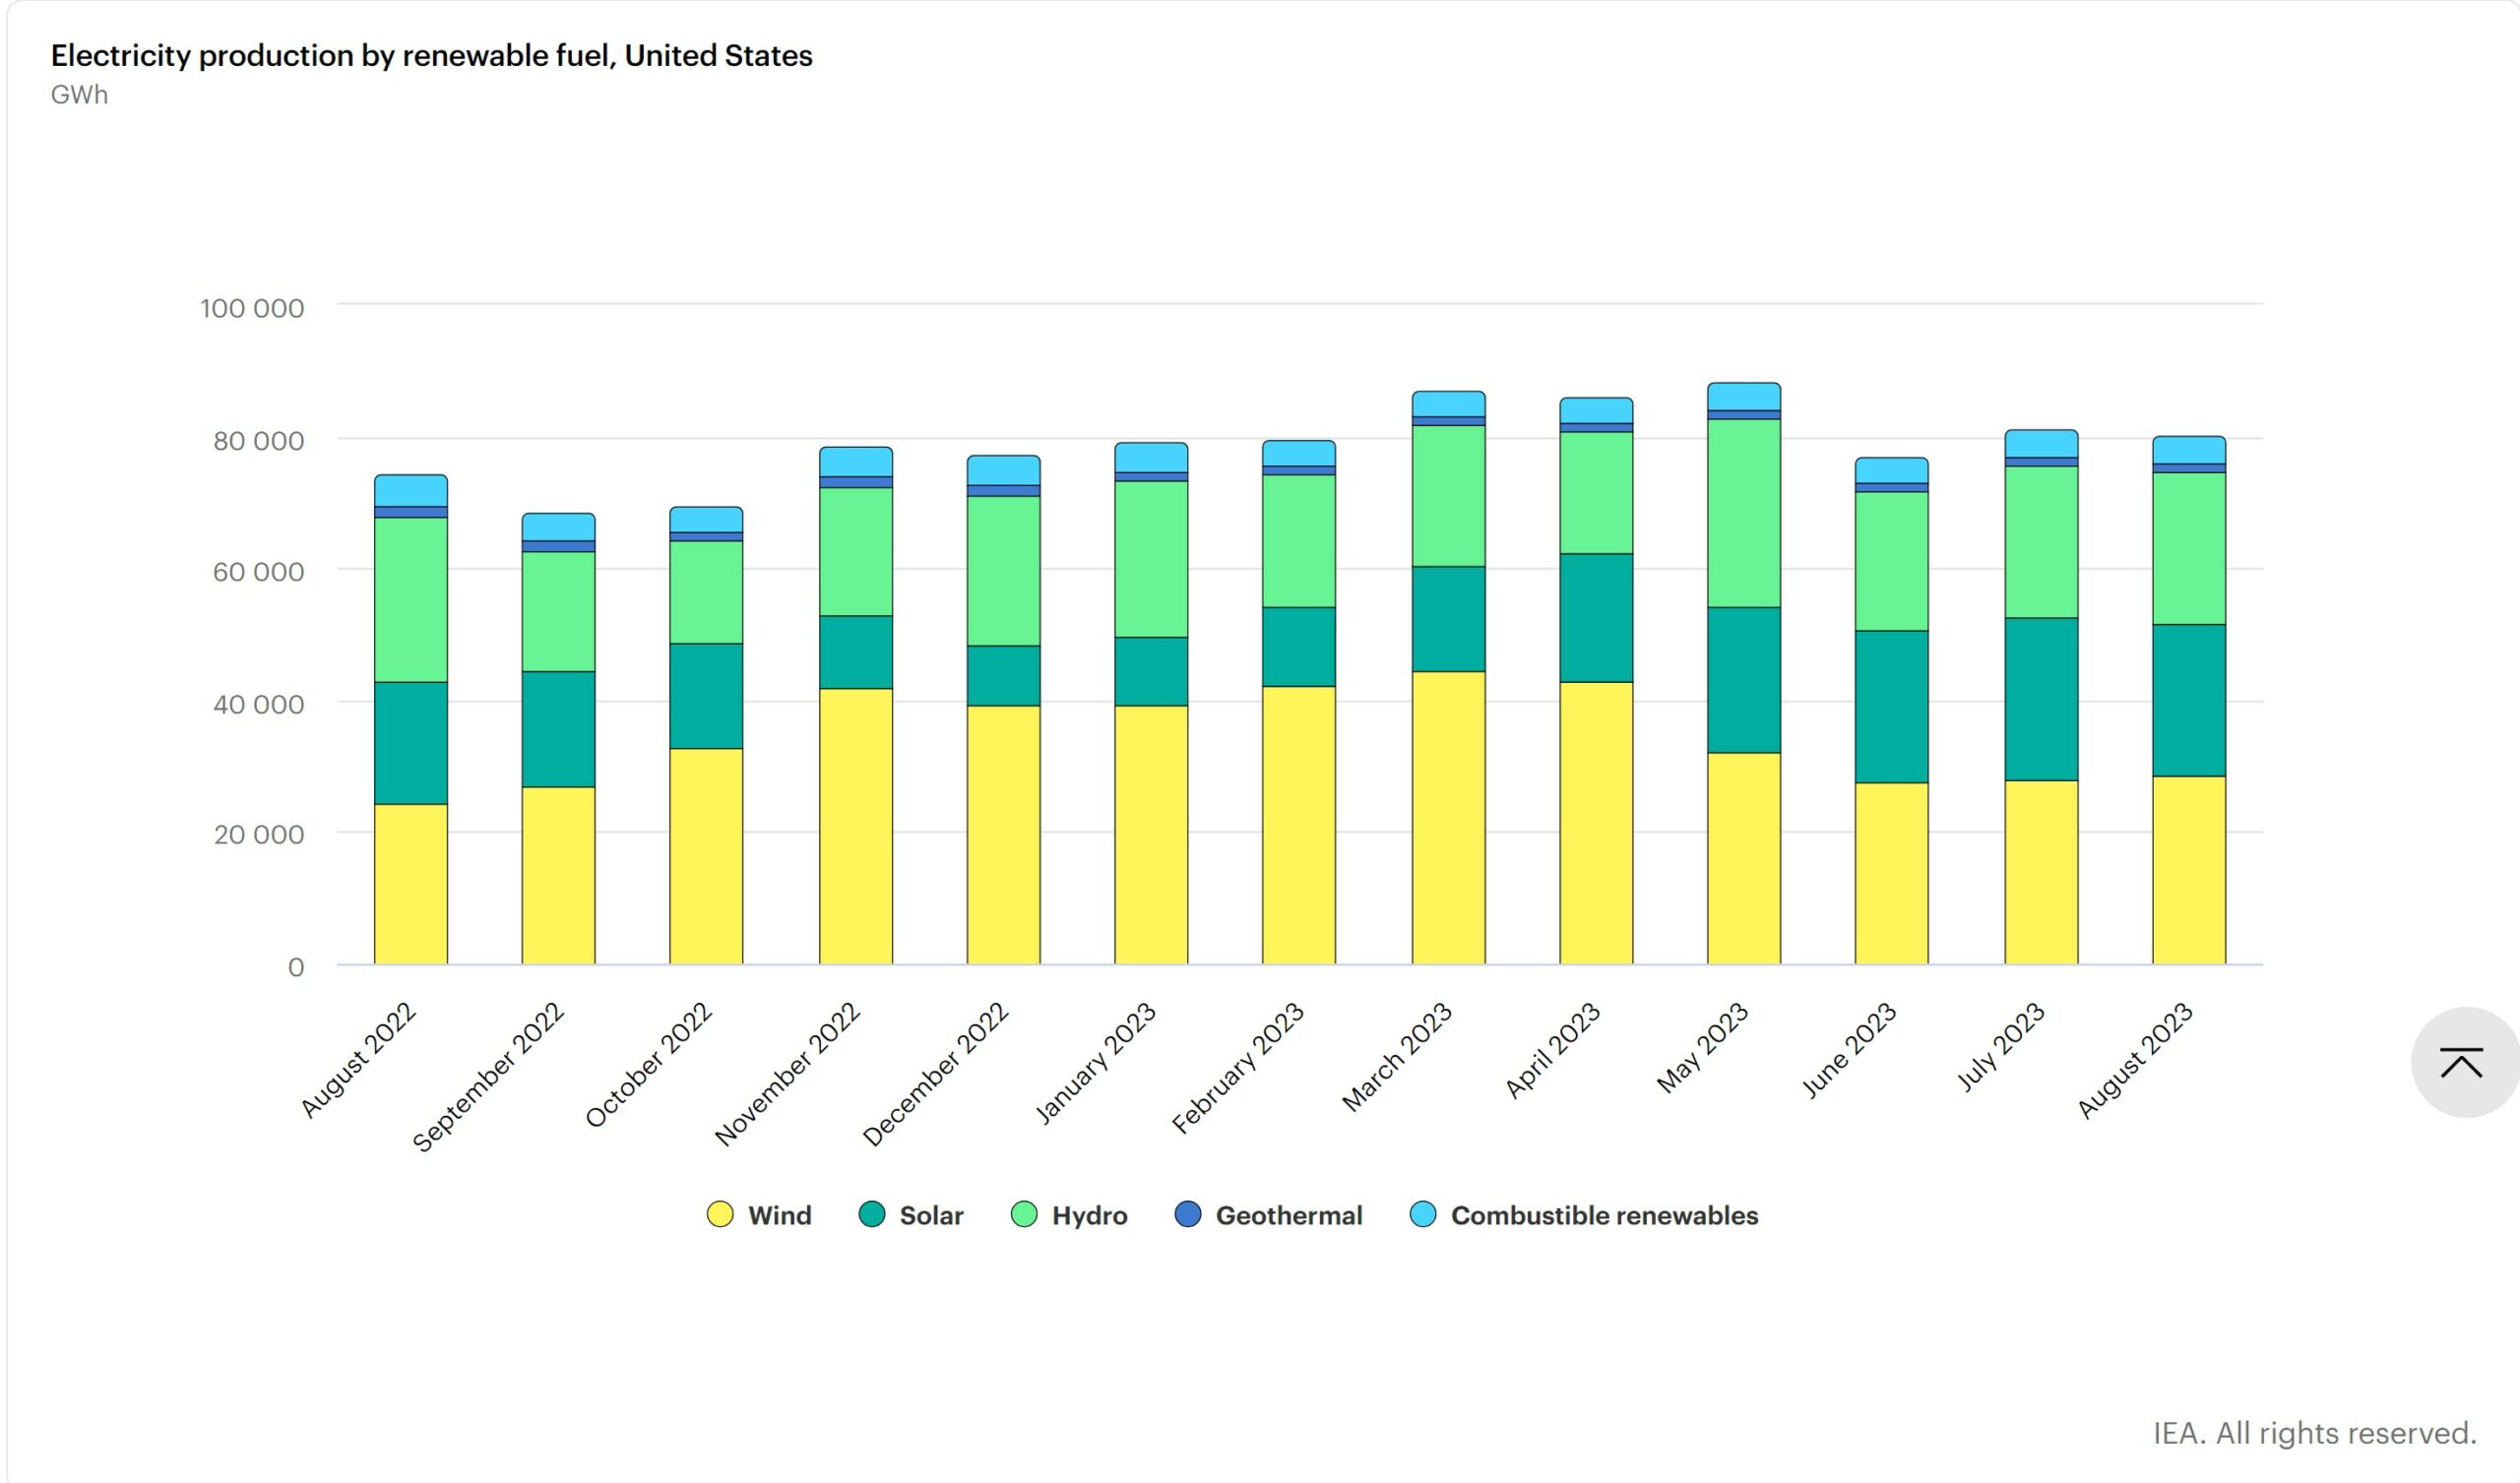
Electricity Production by Renewable Fuels
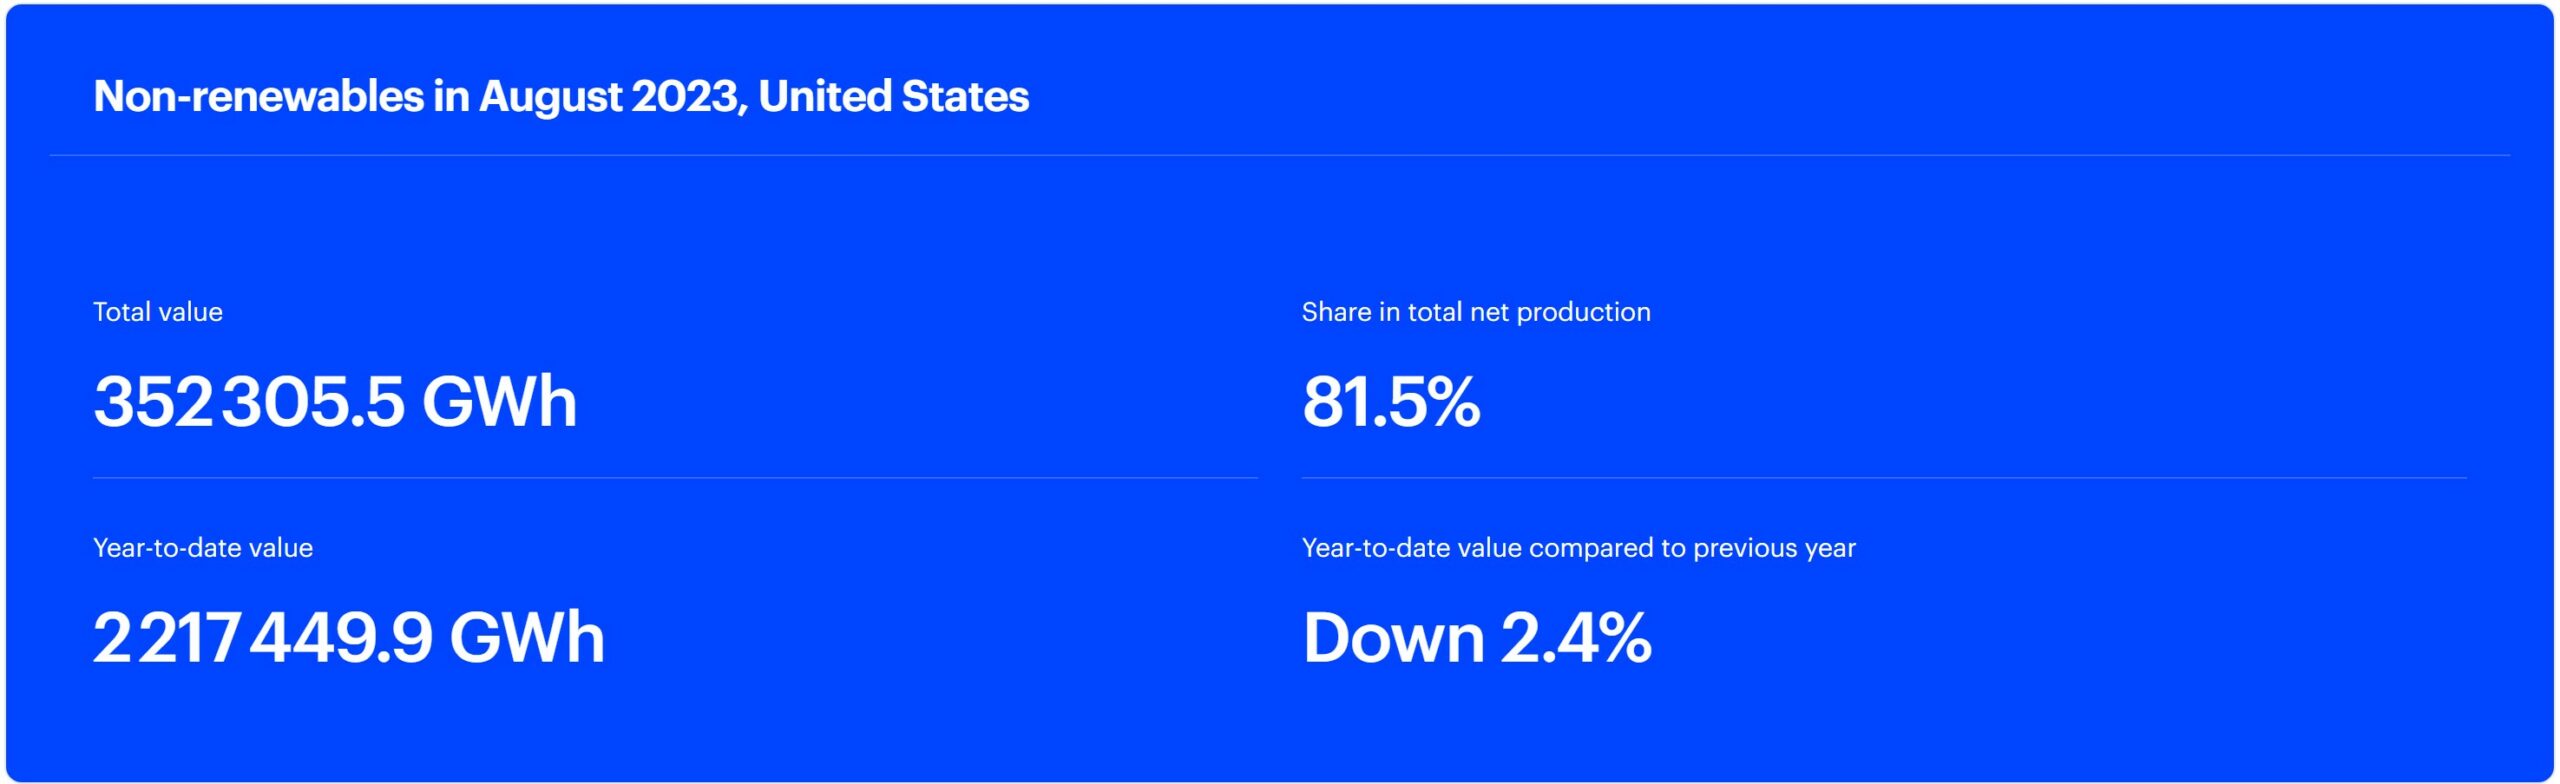
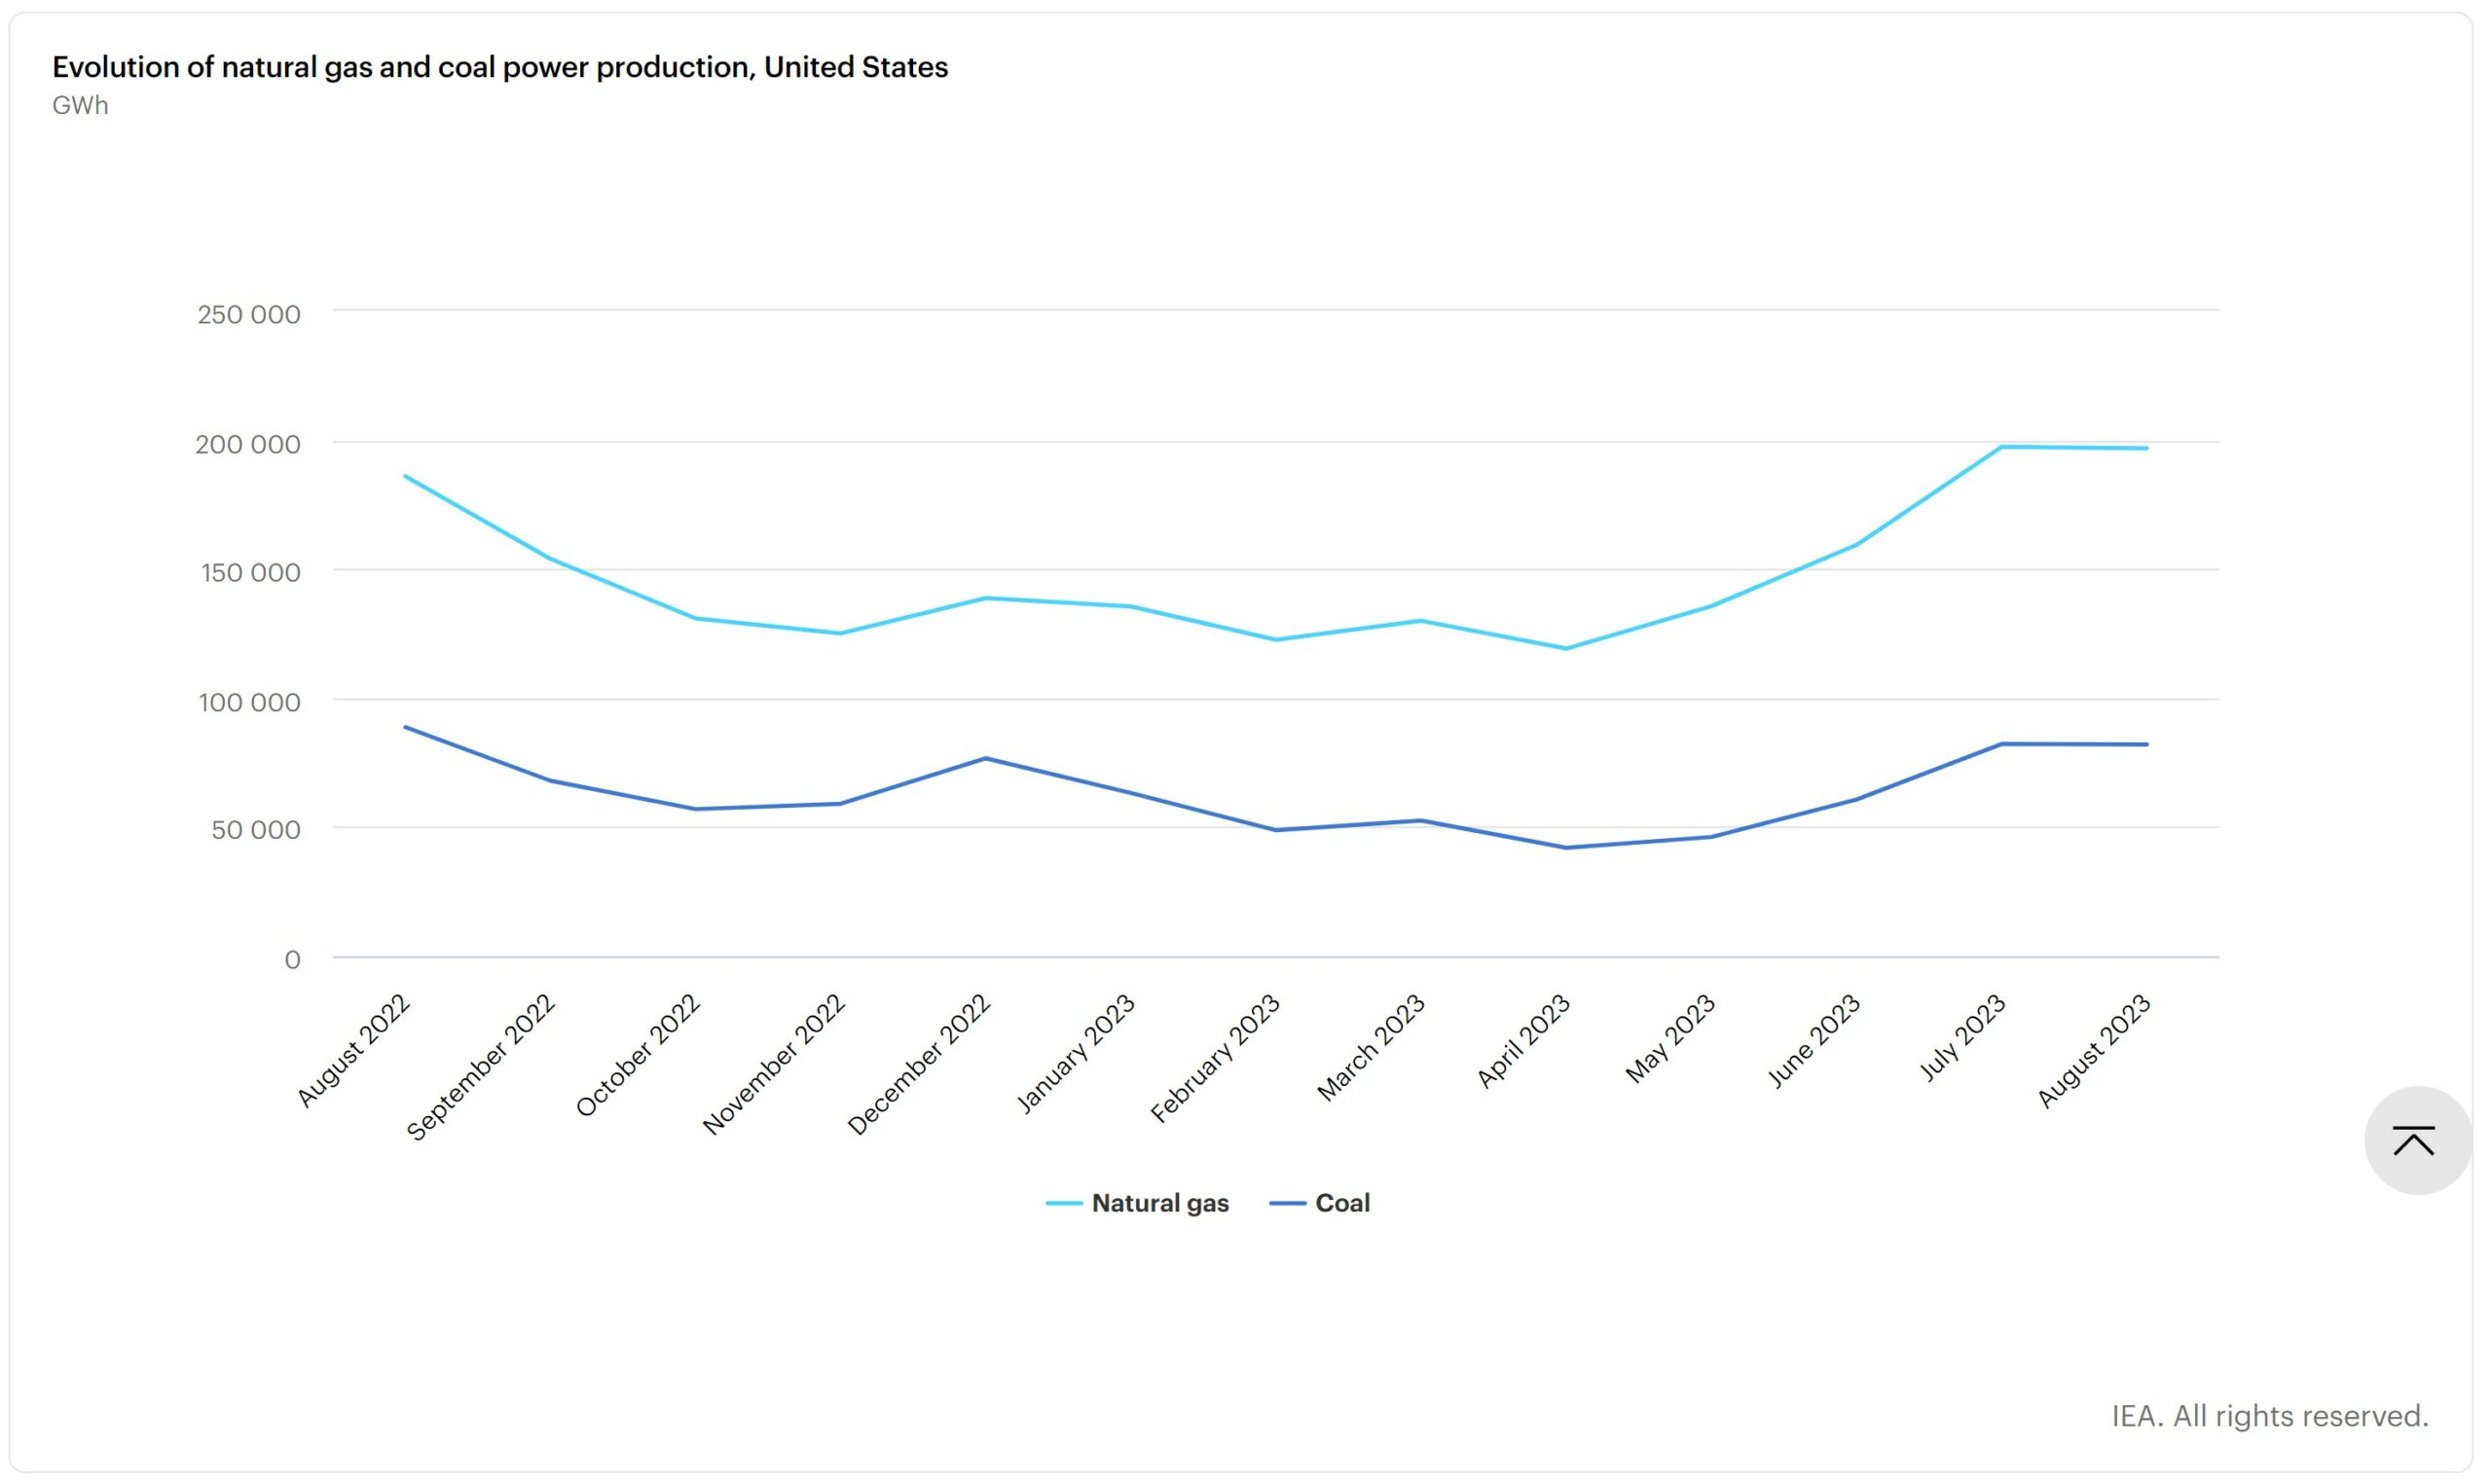
Non-Renewables August 2023
Evolution of Natural Gas and Coal Power Production
Evolution of Fossil Fuel and Nuclear Power Production
Sources
Monthly Electricity Statistics – Data Tools – IEA
Monthly Electricity Statistics – Data product – IEA