Forecasting a further upturn in the unemployment rate: what works? – by New Deal democrat Yesterday I read a post over at Seeking Alpha in which the author confidently predicted a recession in Q1 next year, based exclusively on the NAHB builder sentiment index. Here’s his accompanying graph, comparing builder sentiment with the unemployment rate 17 months later: In case you didn’t already figure it out, the graph forecasts a 7% unemployment rate about 8 months from now. That’s one heckuva recession! My first thought was that, while there clearly is a historical relationship, I hope the author wasn’t really just relying on one data point. The NAHB correlates very closely with mortgage rates, which are important, but hardly a single
Topics:
NewDealdemocrat considers the following as important: Hot Topics, New Deal Democrat, unemployment rate, upturns, US EConomics
This could be interesting, too:
NewDealdemocrat writes JOLTS revisions from Yesterday’s Report
Joel Eissenberg writes No Invading Allies Act
Bill Haskell writes The North American Automobile Industry Waits for Trump and the Gov. to Act
Bill Haskell writes Families Struggle Paying for Child Care While Working
Forecasting a further upturn in the unemployment rate: what works?
– by New Deal democrat
Yesterday I read a post over at Seeking Alpha in which the author confidently predicted a recession in Q1 next year, based exclusively on the NAHB builder sentiment index. Here’s his accompanying graph, comparing builder sentiment with the unemployment rate 17 months later:

In case you didn’t already figure it out, the graph forecasts a 7% unemployment rate about 8 months from now. That’s one heckuva recession!
My first thought was that, while there clearly is a historical relationship, I hope the author wasn’t really just relying on one data point. The NAHB correlates very closely with mortgage rates, which are important, but hardly a single dispositive metric. In particular, note what happened back in 1994 and 1995 when Alan Greenspan raised interest rates sharply – and yet the unemployment rate continued to go down.
I wondered if other metrics from the housing sector had a closer relationship with the unemployment rate. In this regard, let me reiterate that while the unemployment rate is a lagging indicator coming out of recessions, it is a leading one going in. The unemployment rate has *always* risen off its lows before a recession begins. So we are asking, “is there a better leading indicator for the leading indicator (going in to recessions) of the unemployment rate?”
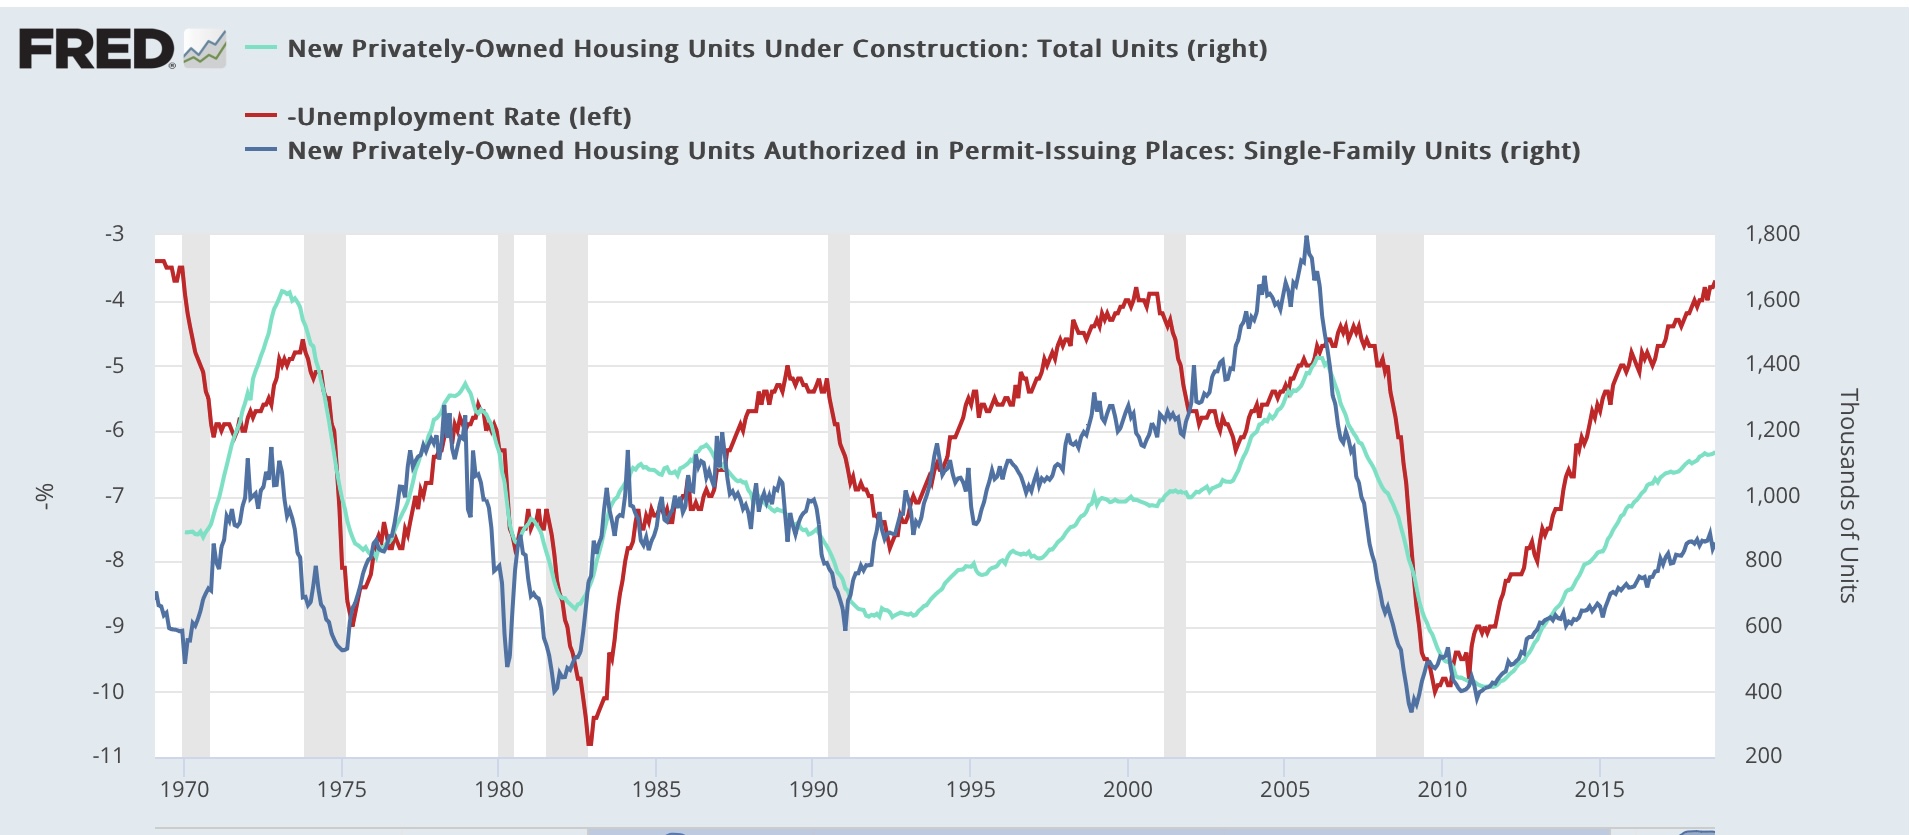
So, here is the historical data for housing permits (dark blue) and housing units under construction (light blue) compared with the unemployment rate (inverted, as in the author’s graph above):
And here is the post-pandemic record:

Historically, both permits and units under construction have turned down before the unemployment rate increased. And although they turn later, units under construction performed almost perfectly in 1994-95, continuing to increase throughout the period exactly as unemployment continued to decrease.
And in the present expansion, units under construction did peak in October 2022, three months before the nadir of the unemployment rate. As I’ve written in previous posts, units under construction with one exception have had to decline about 10% or more before signaling recession.
This also led me to wonder if any of the leading metrics in the employment report typically lead the unemployment rate. With two exceptions, the answer is “no.”
Below I show total goods producing employment (blue), manufacturing (green), construction (purple), and trucking (light blue) compared with the unemployment rate (red, inverted). First, historically:

Here is their post-pandemic record:

All of these generally have turned simultaneously with the increase in unemployment, although several times trucking or construction turned down first. At present, only trucking has turned down in any significant fashion.
But there are two employment metrics which have typically turned first before the unemployment rate: temporary employment and residential construction. Here’s what residential construction looks like historically:

And here is its recent performance:

Now, here is temporary employment:

Temporary employment did indeed turned down before unemployment increased, and is now down sharply. Residential construction turned down simultaneously with the bottom in unemployment, before anomalously turning back up in the past two months. I am curious if this will be revised away next Friday.
Finally, remember that initial jobless claims have an excellent 50+ year record forecasting changes in the unemployment rate. They forecast the recent upturn, and are suggesting that it will not proceed much further, and indeed will reverse downward, in the coming months.
The bottom line is that the typical historical pattern is being followed so far in our current environment. But until more of the coincident employment metrics turn down, and housing units under construction turn down, I think the forecast based on the NAHB sentiment indicator is not supported.