Repeat home sale prices may be easing back into their pre-pandemic YoY range – by New Deal democrat As I forewarned last week, this holiday week is very light on data, so don’t be surprised by me taking some time off. We did get November home prices for repeat sales this morning from both Case Shiller and the FHFA, so let me just pass on a brief note. Seasonally adjusted prices per the FHFA rose 0.2% in November. For the last half year, they have risen on average at about a 2.5% annual rate. *Not* seasonally adjusted prices from Case Shiller also rose 0.2%, a little “hot” for this time of year. Here’s what the last four years of the monthly changes in each look like: And here’s what the YoY% changes in each look like, /2.5 for
Topics:
NewDealdemocrat considers the following as important: home sale prices, Hot Topics, US EConomics
This could be interesting, too:
NewDealdemocrat writes JOLTS revisions from Yesterday’s Report
Joel Eissenberg writes No Invading Allies Act
Bill Haskell writes The North American Automobile Industry Waits for Trump and the Gov. to Act
Bill Haskell writes Families Struggle Paying for Child Care While Working
Repeat home sale prices may be easing back into their pre-pandemic YoY range
– by New Deal democrat
As I forewarned last week, this holiday week is very light on data, so don’t be surprised by me taking some time off.
We did get November home prices for repeat sales this morning from both Case Shiller and the FHFA, so let me just pass on a brief note.
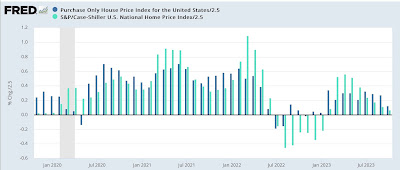
Seasonally adjusted prices per the FHFA rose 0.2% in November. For the last half year, they have risen on average at about a 2.5% annual rate. *Not* seasonally adjusted prices from Case Shiller also rose 0.2%, a little “hot” for this time of year. Here’s what the last four years of the monthly changes in each look like:
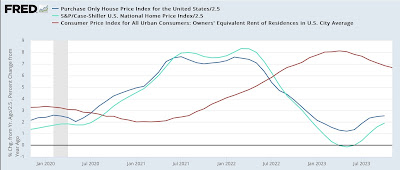
And here’s what the YoY% changes in each look like, /2.5 for scale, compared with Owners’ Equivalent Rent in the CPI:
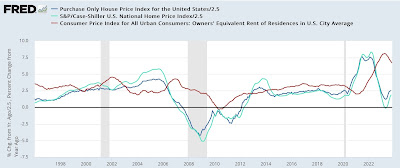
Here’s a longer term look at the same:
Over the longer term, a 2.5% annual increase has been about par for the course, especially for the FHFA index. Note that the YoY change in that index in particular looks like it may be easing back into that range.
Because the house price indexes lead OER by 12 months or more, I expect that YoY change in the latter to continue to decline, although the pace of decline has been slower than I expected earlier this year.
House resale price indexes confirm upturn in prices for existing homes, but do not negate combined price declines, Angry Bear, by New Deal democrat


