Been looking around for a few, new, and good writers to add to Angry Bear. I know we have Robert, New Deal democrat, and Joel amongst us now. I ran into Steve Roth since he posted to Tom Walker’s post. He is allowing me to poach from his new substack Wealth Economics and an older blog site Asymptosis. Happy about this as it allows me to write more freely too. Anyway, this commentary of Steves’ I like. Do We Wildly Underestimate GDP? Wealth Economics, Steve Roth. Our production minus our consumption doesn’t come close to explaining our wealth accumulation. Do the asset markets know better? In national accounting, there are two ways of estimating what all our real-world stuff is worth. They’re both market measures, based on what people pay for
Topics:
Steve Roth considers the following as important: GDP, Hot Topics, US EConomics, US/Global Economics
This could be interesting, too:
NewDealdemocrat writes JOLTS revisions from Yesterday’s Report
Joel Eissenberg writes No Invading Allies Act
Bill Haskell writes The North American Automobile Industry Waits for Trump and the Gov. to Act
Bill Haskell writes Families Struggle Paying for Child Care While Working
Been looking around for a few, new, and good writers to add to Angry Bear. I know we have Robert, New Deal democrat, and Joel amongst us now. I ran into Steve Roth since he posted to Tom Walker’s post. He is allowing me to poach from his new substack Wealth Economics and an older blog site Asymptosis. Happy about this as it allows me to write more freely too. Anyway, this commentary of Steves’ I like.
Do We Wildly Underestimate GDP? Wealth Economics, Steve Roth.
Our production minus our consumption doesn’t come close to explaining our wealth accumulation. Do the asset markets know better?
In national accounting, there are two ways of estimating what all our real-world stuff is worth. They’re both market measures, based on what people pay for stuff.
- The canonical national-accounting method: tally up what we produced each year (based on how much units spent to purchase all that stuff, = GDP), and subtract what we consumed each year (measured by spending on consumption goods, which get consumed by definition, plus “consumption” of fixed capital — depreciation of our long-lived stuff).1 Then sum the results over the years. This is the cumulative sum of “net investment” or “net capital formation” (which by construction in the national accounts = “saving”). The result is our stock of “fixed capital.”2
- Look at the value of all our account/balance-sheet assets at the end of each year, and assume that’s what all our stuff is worth. The prices/values of those assets are determined by the all-wise asset markets, scanning across all our tangible and intangible stuff, tradeable and non-tradeable, and estimating what it’s actually “worth” in toto. (Based on our capacity to produce future output, or whatever valuation methods you choose to impute to asset-holders when they’re making their trading/portfolio decisions.)
The second measure is what everybody uses as the measure of a country’s “national wealth.”
These two measures don’t even come close to matching — even if we inflation-adjust the investment series (because previous years’ spent dollars were “worth more”).
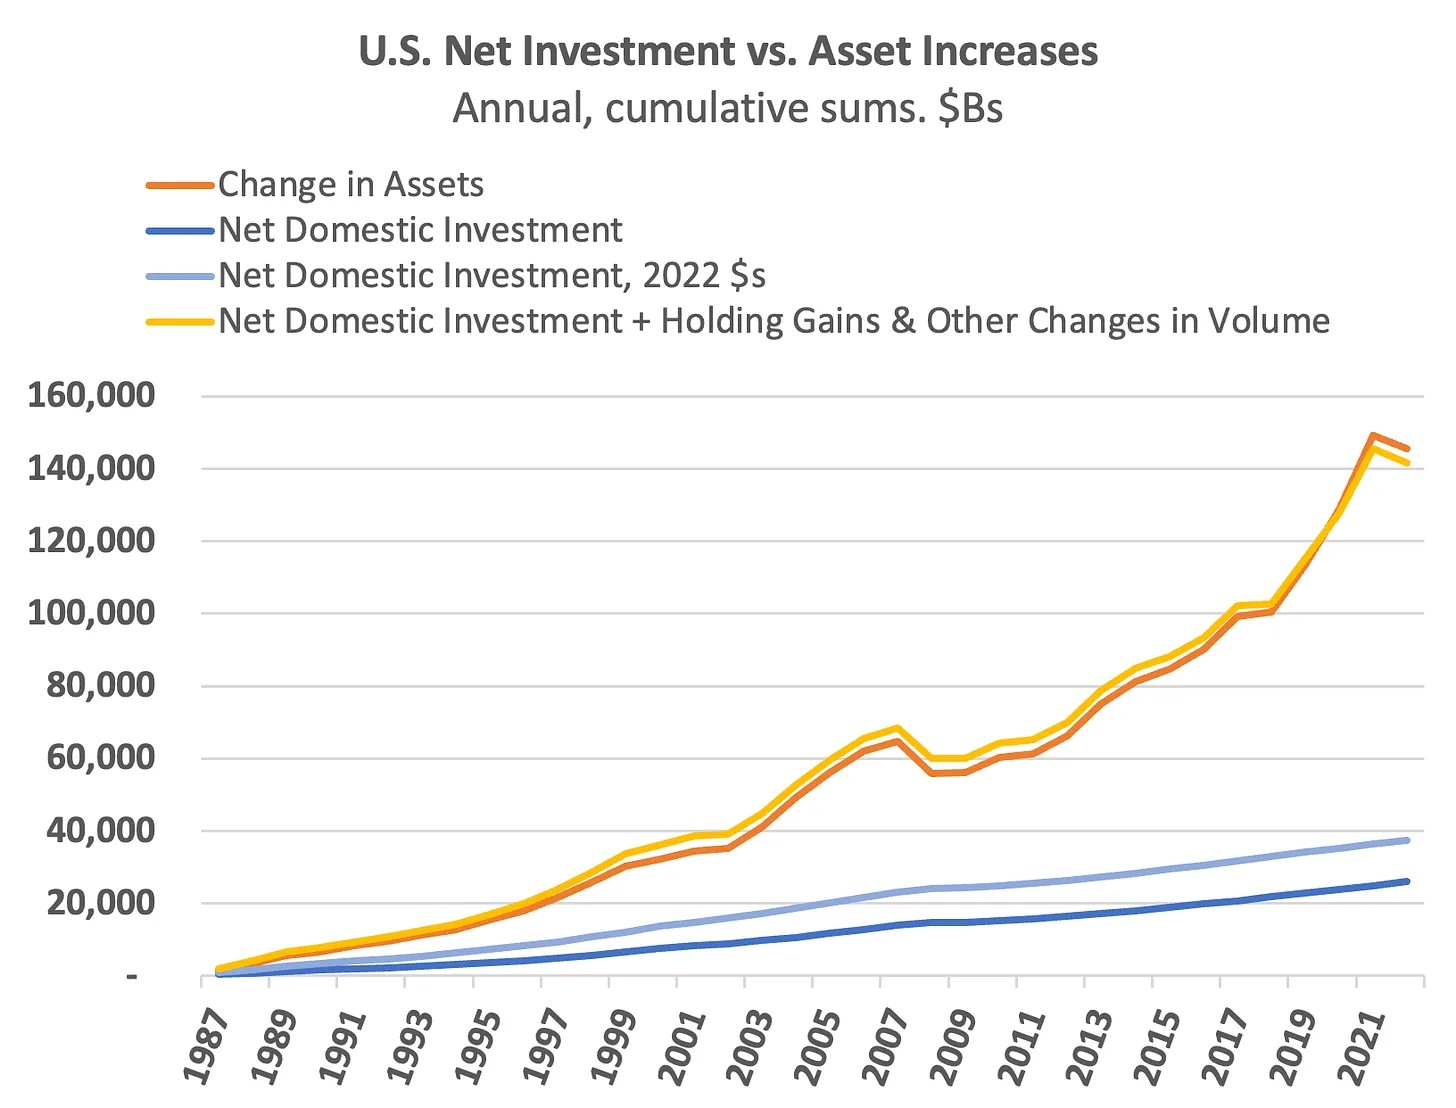
The asset markets think our stuff is worth way more than the national accountants do. There’s a simple accounting explanation for this: a huge amount of asset accumulation doesn’t come from “transactions” (formerly called “flows” in the Financial Accounts), which is what’s tallied in GDP and investment. It comes from capital or “holding” gains (plus other changes in volume).3
Accountants are just looking at what’s produced each year, based purely on what people pay for it. And they have a quite narrow view of what counts as investment (vs consumption) spending. Spending on education, for instance, doesn’t count as investment, even though it clearly produces immense quantities of valuable, productive, long-lived, real-world stuff: knowledge, skills, abilities, etc. that are arguably the largest and most powerful “inputs to production.” When people work for hire, they’re selling “capital services” from that individually owned (and inalienable) “human capital.”4 Education is just one example of what’s missing.
By contrast, asset markets have a very broad view. They’re collectively scanning across all our produced-and-unconsumed stuff, accumulated since forever, of any type or description. A better-educated, healthier populace? An explosion in the productivity promise of generative AI? Innumerable other (innumerable) changes? Bid up asset prices. Every brokerage in the world sees those price changes, and marks all their customers’ assets to market, instant by instant. Voilà, there are more assets. This is the mechanism of holding gains.
Now, who you gonna trust? A bunch of pettifogging accountants with a very narrow view of “investment,” or the wisdom of the asset-market crowds?
Here’s GDP as reported, versus GDP if we trust the asset markets’ view of what our stuff is worth.
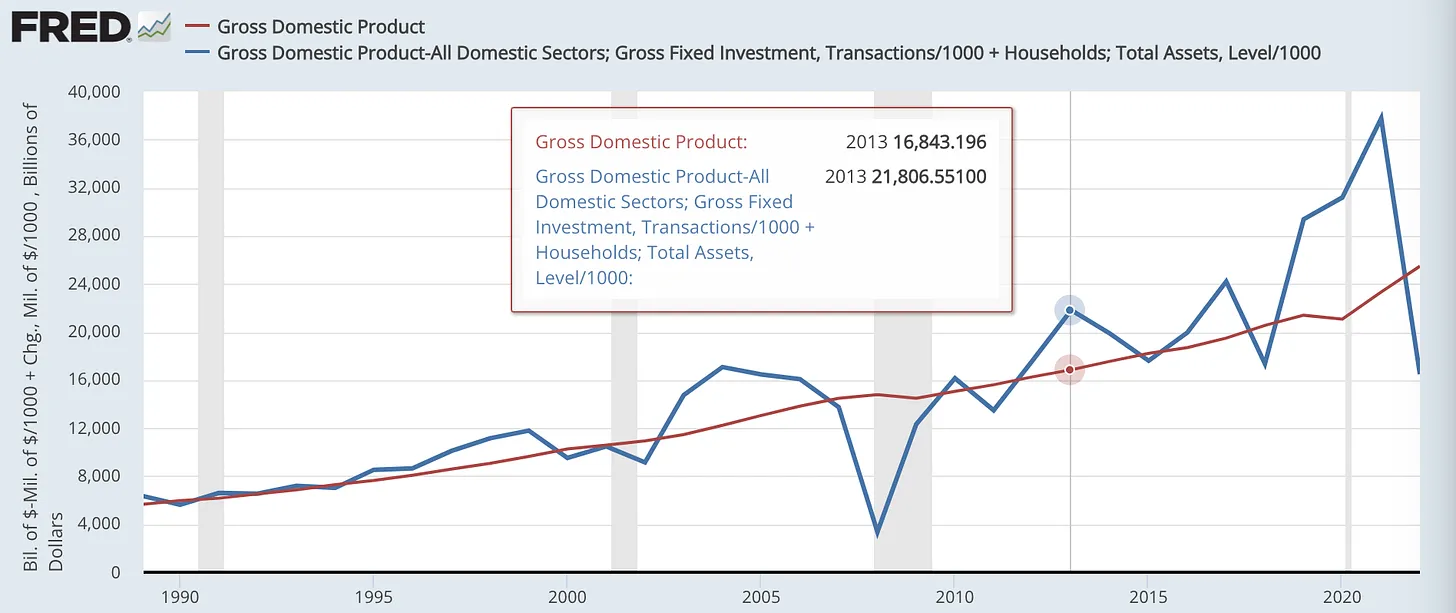
The blue line is each year’s GDP – investment = consumption, + change in assets.5 Here’s another look at it:
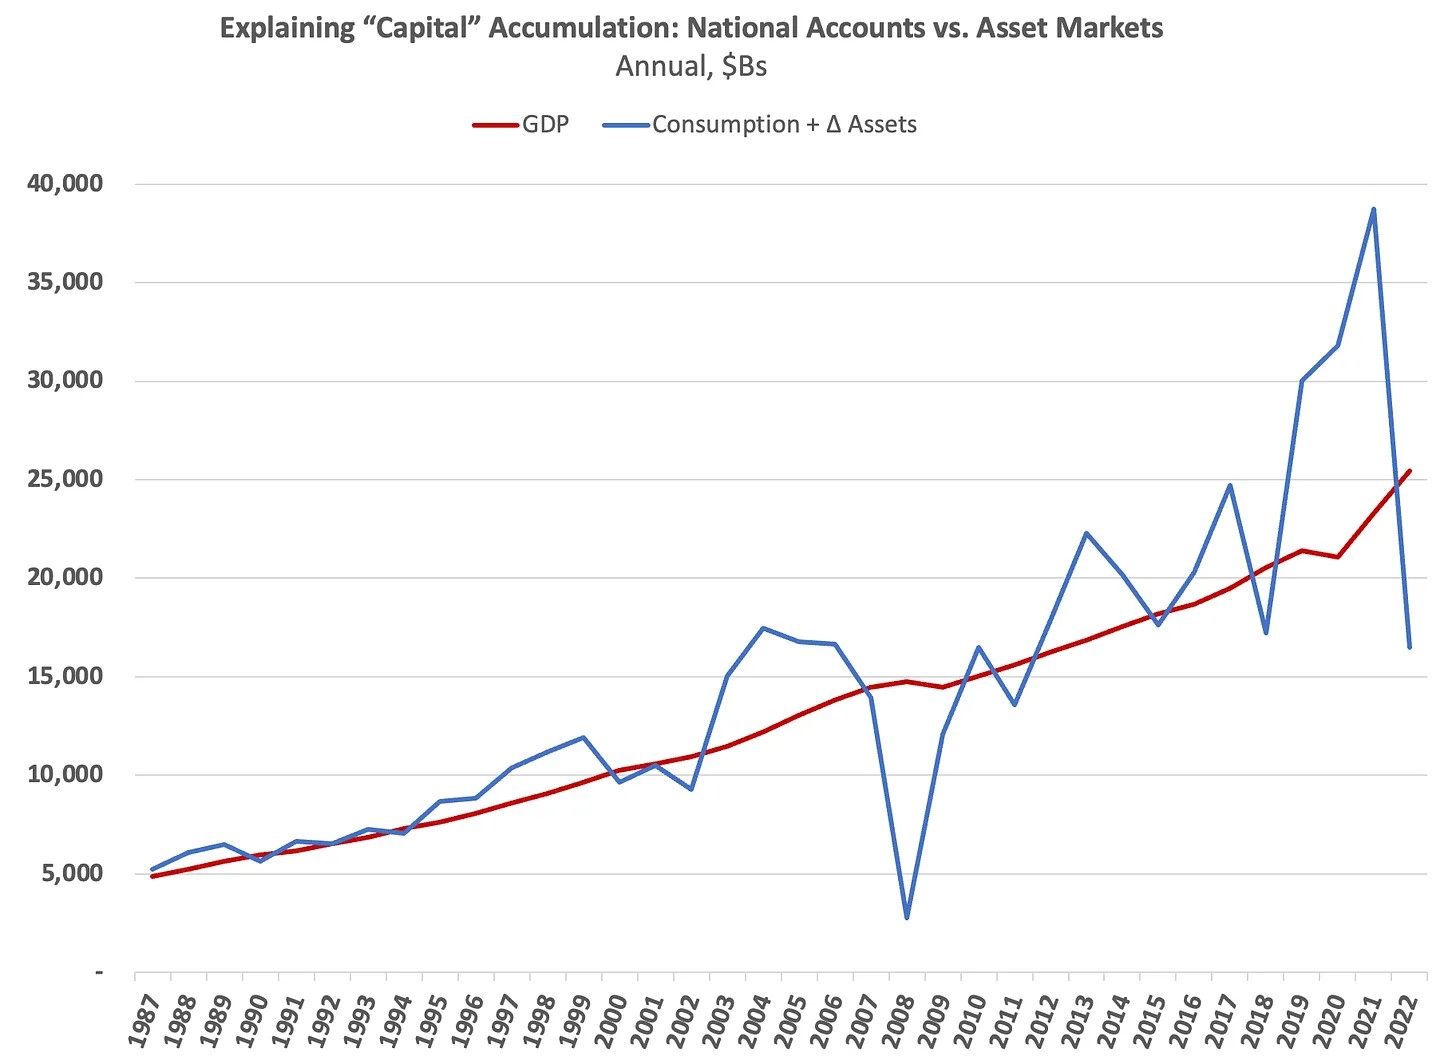
2000–2023, the asset-market measure averages 10% higher. 2009–2023, 13% higher.
Now of course: you could claim that we’re in The Mother of All Multi-Decadal Asset Bubbles — that asset prices will go way down, and stay down. “We can’t trust the asset markets’ estimates of what our stuff is worth.” You may be right. More power to you.6
Key to understand: this alternate measure isn’t a measure of what was produced in each year. It doesn’t claim that production in 2013 was $22T. It’s only meaningful over time, because past years’ produced and unconsumed output (our real “capital,” writ large) is being revalued each year, by the eternal and fitful wisdom of the asset markets.
This all suggests that the sale prices of long-lived goods in past years, and hence GDP, were wrong — either because 1. they weren’t recognized as long-lived goods production at all (education from reading Wikipedia, and buying/watching Netflix documentaries and YouTube videos?),7 or 2. because the stuff that the accountants did recognize as new long-lived goods turned out to be surprisingly more valuable and productive, in future years.
It’s hard to say which is right (or wrong). “The markets” know all. They’re just not telling.
Notes
1 Consumption spending + consumption of fixed capital (CFC) could valuably be called Gross Consumption. Net consumption is the consumption spending (and subsequent consumption) only. This just flips the treatment of CFC that’s used in gross vs. net investment.
2 The term is kind of a throwback to the 19th century, when “fixed” stuff like steam pumps and drill presses comprised much more of our “capital.” These days it includes much more, notably including intellectual property — even including “brand value” a.k.a. trademark rights.
3 Modern national accounts based on the U.N.’s System of National Accounts (like the U.S. Integrated Macroeconomic Accounts, IMAs — the S tables in the Fed’s quarterly Z.1 report) draw a blessedly clear line between “volume” and “(re)valuation” changes in their balance-sheet-complete accounting. Though of course there are edge cases where that line is blurry.
4 “Human capital” has a justifiably very bad rep based on the whole “declining marginal productivity” (read: value) of workers claptrap. But in this context it’s a perfectly coherent (and unobjectionable?) concept.
5 Note that consumption plus change in assets/net worth is precisely the definition of comprehensive, balance-sheet-complete “Haig-Simons” income — which economists over decades have referred to as the “preferred” measure of income (because it’s necessary for balance-sheet-complete accounting). Haig-Simons also equals “saving” (net investment) as typically defined, plus holding gains, which = change in assets/NW. H-S in its standard form doesn’t include Other Changes in Volume, which is also necessary in practice given the construction of national accounts. More for the curious, here.
6 The discrepancy became much more extreme starting in the 1990s, as holding gains comprised an ever-larger portion of asset-holders’ “total returns” on assets (and of their comprehensive, Haig-Simons income). A longer-term graph shows a big sea change. Suggested explanations from my gentle readers would be more than welcome.
7 Semi-aside: The value of undeniably productive “home work” is definitely not counted in GDP, much less investment. It’s not remunerated in dollars, so it’s outside accountants’ “production boundary.” Tallying up hours of home work that most of us would agree is productive, at median wage, would increase GDP by about a third. (How productive would our economy be if nobody was doing all that home work?)