Using the stock market and unemployment as an easy and timely coincident recession indicator – by New Deal democrat My fellow forecaster Bob Dieli has a measure he calls “DeltaDelta,” basically an average of the YoY% change in the stock market and the unemployment rate (which hopefully he won’t mind me mentioning here). It called to mind that occasionally in the past I have noted that a YoY decline in stock prices is a yellow flag for a potential recession, although there are many false positives. I wondered whether the signal might improve if, rather than averaging the two, for a signal I insisted that each of the measures be negative YoY. So here’s where that led me. First, here’s what the YoY% change of the average of the two measures –
Topics:
NewDealdemocrat considers the following as important: Hot Topics, US EConomics
This could be interesting, too:
NewDealdemocrat writes JOLTS revisions from Yesterday’s Report
Joel Eissenberg writes No Invading Allies Act
Bill Haskell writes The North American Automobile Industry Waits for Trump and the Gov. to Act
Bill Haskell writes Families Struggle Paying for Child Care While Working
Using the stock market and unemployment as an easy and timely coincident recession indicator
– by New Deal democrat
My fellow forecaster Bob Dieli has a measure he calls “DeltaDelta,” basically an average of the YoY% change in the stock market and the unemployment rate (which hopefully he won’t mind me mentioning here). It called to mind that occasionally in the past I have noted that a YoY decline in stock prices is a yellow flag for a potential recession, although there are many false positives. I wondered whether the signal might improve if, rather than averaging the two, for a signal I insisted that each of the measures be negative YoY. So here’s where that led me.
First, here’s what the YoY% change of the average of the two measures – stock market and unemployment rate – goes back to the beginning of the Wilshire 5000 total market index over 40 years ago (S&P only lets FRED publish the last 10 years of that measure, but since on a YoY basis it is virtually identical to the Wilshire 5000, there’s no loss):
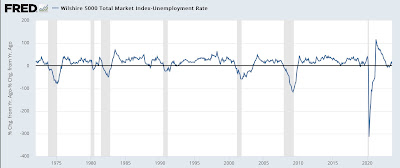
This measure occasionally leads and occasionally lags by several months, but overall is a good coincident indicator. There are a few false positives, notably two months in autumn 1988, and one month each in 1992 and early 2019. Interestingly, it was also negative last December and this past March.
Now let’s see what it looks like divided up, and also divided into pre- and post- pandemic lockdown sections:
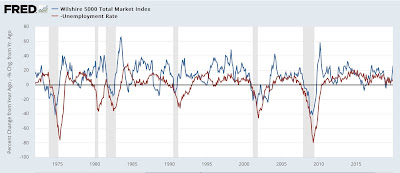
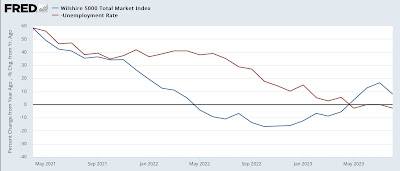
The false positives all go away, as do the two below 0 readings in the past year. On the other hand, this look misses the 1980 recession. It occurred to me that adjusting stock market returns for inflation might take care of that, and it did:
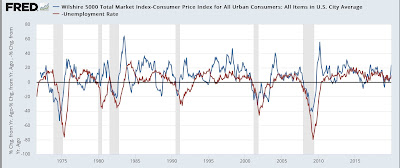
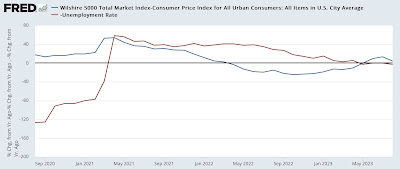
Interestingly, it also indicates a slightly below 0 readings from this past April.
Finally, because initial jobless claims lead the unemployment rate, I substituted the former for the latter, and here’s what I got:
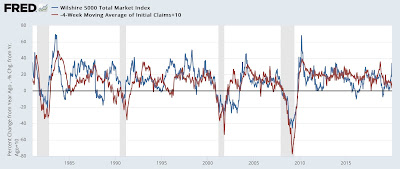
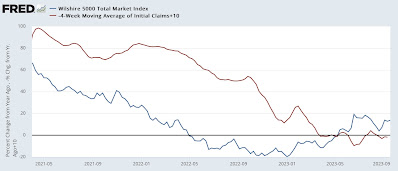
It doesn’t improve the model, partly because I need to adjust initial claims by 10%, and partly because stock market returns often don’t turn negative YoY until after a recession begins.
Still, I think tracking both stock market returns as well as either the unemployment rate or initial claims YoY does add value. That’s because the former generally provides a measure of the broad producer side of the economy (vs. for example the ISM manufacturing index, which only measures one slice of it), while the former provides a measure for the consumer side. At present what it is telling us is that the consumer is likely weakening, while producers still see clear sailing in the months ahead.
Since the stock market bottomed at the beginning of last October, for the next several months YoY comparisons will be easy:
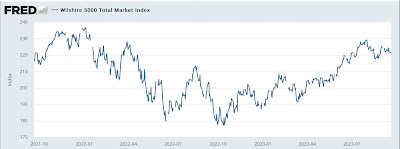
In my weekly updates, to avoid noise and being whipsawed, I look at the last 3 months to see if the stock market has made a new high or low. At the moment the market is a positive, given the 12 month high it made at the end of July. Unless the market makes a new 3 month low, that rating will continue until at least the end of October.
Scenes from the employment report: important leading and coincident indicators of recession, Angry Bear, New Deal democrat.
