The un(der)employment rate leads wage growth: 2023 update – by New Deal democrat I had already planned on taking an updated look at wage growth today, but there was a little flutter on twitter about job openings and last week’s Q1 wage and benefits data, so that sealed the deal. To wit: as I used to write many times during the last expansion, wage growth is a long lagging indicator. It tends to increase only after unemployment (or even better, underemployment) falls to a level where labor begins to have some bargaining power. For the underemployment rate, this was about 9%. It took over half a decade after the Great Recession for the U6 rate to hit that marker: So the below graph subtracts the U6 rate from 9% (red), so that any rate
Topics:
NewDealdemocrat considers the following as important: New Deal Democrat, under employment, US EConomics, wage growth 2023
This could be interesting, too:
NewDealdemocrat writes JOLTS revisions from Yesterday’s Report
Bill Haskell writes The North American Automobile Industry Waits for Trump and the Gov. to Act
Bill Haskell writes Families Struggle Paying for Child Care While Working
Joel Eissenberg writes Time for Senate Dems to stand up against Trump/Musk
The un(der)employment rate leads wage growth: 2023 update
– by New Deal democrat
I had already planned on taking an updated look at wage growth today, but there was a little flutter on twitter about job openings and last week’s Q1 wage and benefits data, so that sealed the deal.
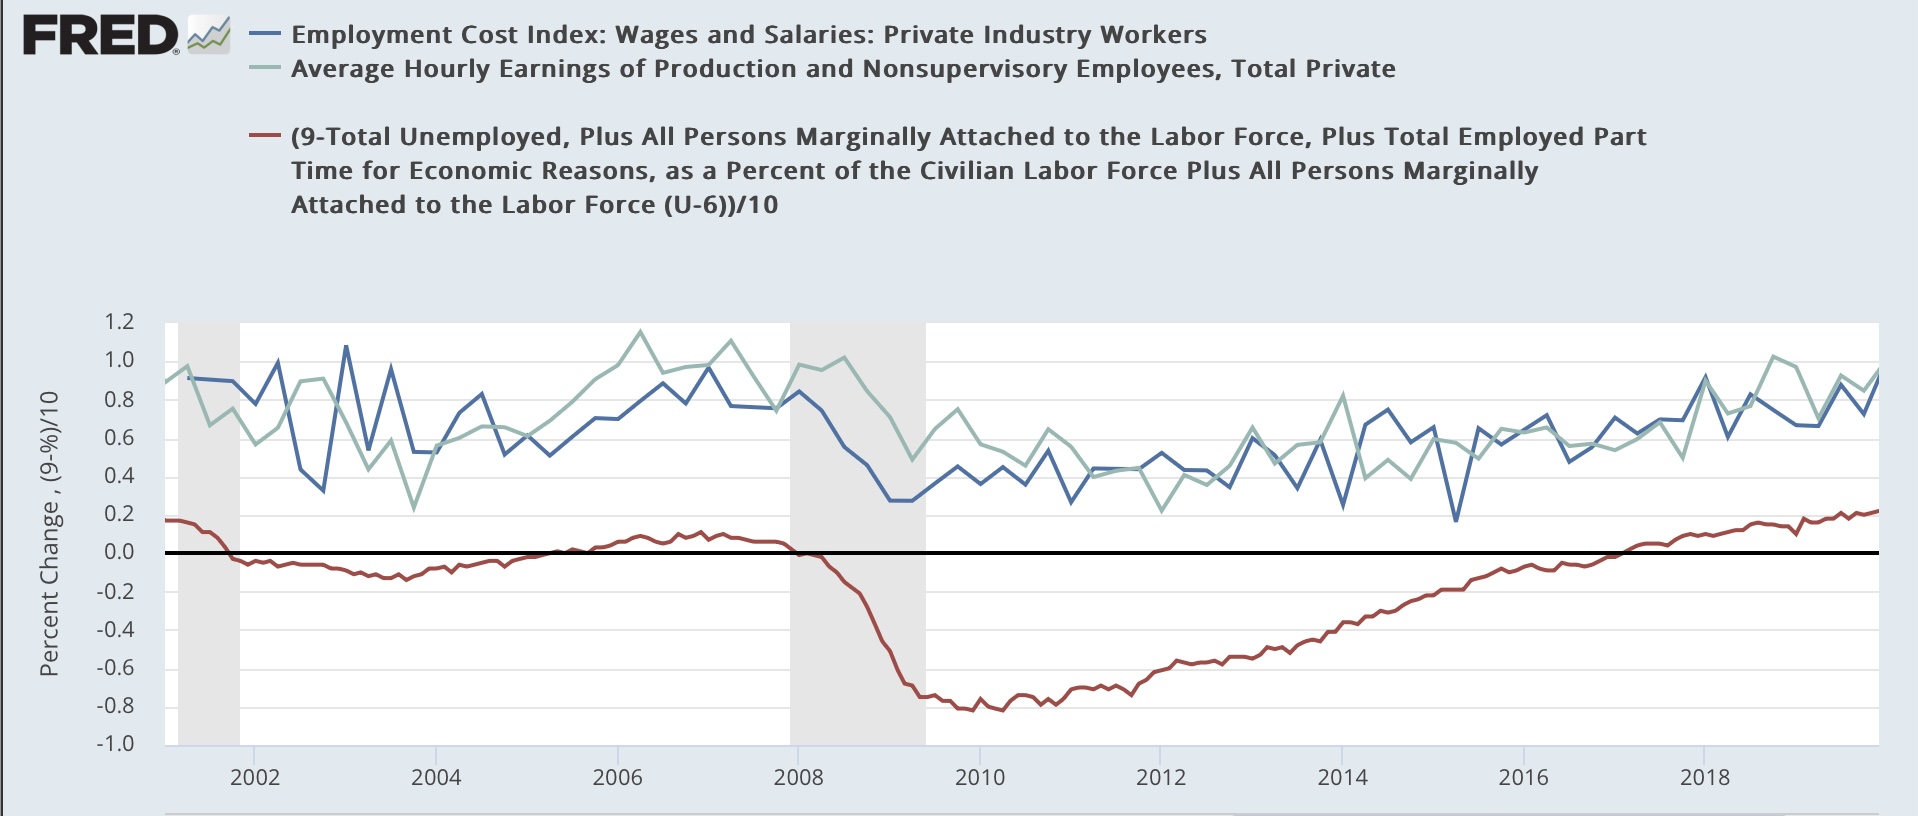
To wit: as I used to write many times during the last expansion, wage growth is a long lagging indicator. It tends to increase only after unemployment (or even better, underemployment) falls to a level where labor begins to have some bargaining power. For the underemployment rate, this was about 9%. It took over half a decade after the Great Recession for the U6 rate to hit that marker:

So the below graph subtracts the U6 rate from 9% (red), so that any rate lower than 9% shows as a positive, compared with the YoY% change in average nonsupervisory wages (light blue) and wages measured by the quarterly employment cost index (dark blue):
Because the underemployment rate went to over 20% in the first few months of the pandemic, the below continuation graph eliminates those months and picks up in the last quarter of 2020:

As the labor market got tighter, wages growth continued to accelerate.
Economist Jason Furman made a similar point several days ago comparing the job openings rate with wage growth. Here’s his graph:

A graph of the quarterly % changes in wage growth in nonsupervisory wages and the employment cost index does not particularly correlate with the quarterly % change in job openings:

But the YoY% change in wages do correlate with the absolute level of job openings:

As the level of employment continues to reach post-pandemic equilibrium, the level of job openings will continue to decline, and the underemployment rate will likely increase. This will cause wage growth to decelerate as well.
Another strong showing for jobs and unemployment; strong wage growth likely lags inflation, Angry Bear, New Deal democrat.