First, this report (GDP and Income) is almost three months old. The latest release: will be June 28, 2024. “Gross Domestic Product by State and Personal Income by State, 1st Quarter 2024.” Some detail establishing a base for the June 28, 2024 report which will cover 1st Qtr. 2024. Briefly: The BEA has updates on population which I will have to check out. If you remember from New Deal democrats report, there has been a discrepancy between Household and Establishment numbers. It is thought the one report did not include immigration numbers. “continuing severe disconnect between the Establishment Survey, which continues to show strong growth, and the Household Survey, which has been downright recessionary.“ The detail is in the report, real
Topics:
Angry Bear considers the following as important: GDP and Income, US EConomics
This could be interesting, too:
NewDealdemocrat writes JOLTS revisions from Yesterday’s Report
Bill Haskell writes The North American Automobile Industry Waits for Trump and the Gov. to Act
Bill Haskell writes Families Struggle Paying for Child Care While Working
Joel Eissenberg writes Time for Senate Dems to stand up against Trump/Musk
First, this report (GDP and Income) is almost three months old. The latest release: will be June 28, 2024. “Gross Domestic Product by State and Personal Income by State, 1st Quarter 2024.”
Some detail establishing a base for the June 28, 2024 report which will cover 1st Qtr. 2024.
Briefly:
The BEA has updates on population which I will have to check out. If you remember from New Deal democrats report, there has been a discrepancy between Household and Establishment numbers. It is thought the one report did not include immigration numbers. “continuing severe disconnect between the Establishment Survey, which continues to show strong growth, and the Household Survey, which has been downright recessionary.“
The detail is in the report, real GDP for the nation grew at an annual rate of 2.5 percent. The percent change ranging from 5.9 percent in North Dakota to –1.2 percent in Delaware. Fourth Quarter 2023, real GDP for the nation grew at an annual rate of 3.4 percent.
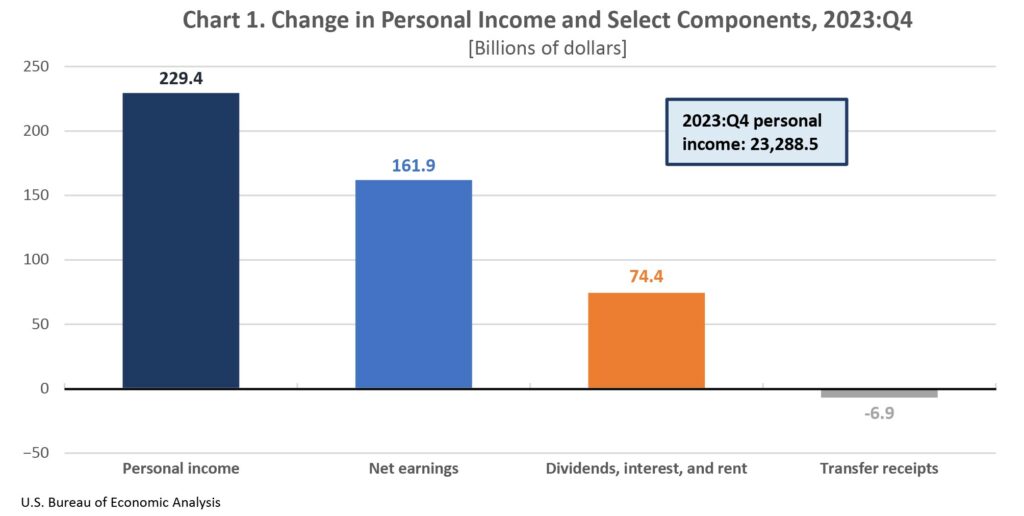
Fourth quarter of 2023, current-dollar personal income increased $229.4 billion. Or 4.0 percent at an annual rate. The increases in earnings and property income (dividends, interest, and rent) were partially offset by a decrease in transfer receipts. Percent change in earnings ranged from 8.5 percent in Nevada to –0.8 percent in North Dakota.
Earnings increased in 48 states and the District of Columbia and grew at 4.6 percent nationally.
Personal income for the nation increased at an annual rate of 5.2 percent. The percent change ranging from 7.0 percent in Florida to 3.4 percent in Indiana.
Gross Domestic Product by State and Personal Income by State, 4th Quarter 2023 and Preliminary 2023, BEA Data
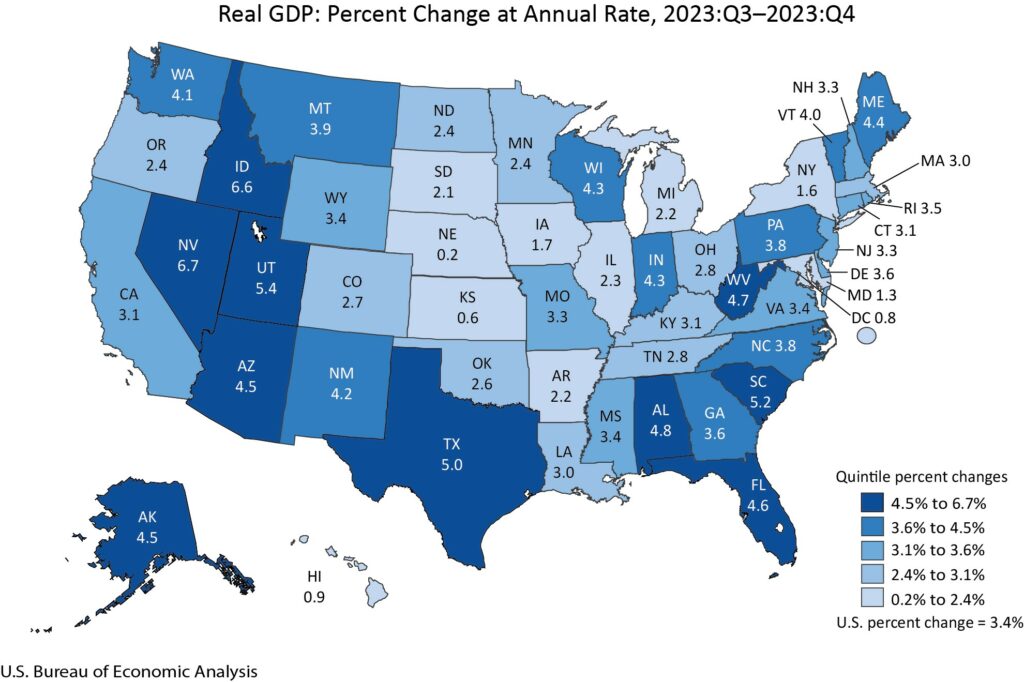
Real gross domestic product (GDP) increased in all 50 states and the District of Columbia in the fourth quarter of 2023, with the percent change ranging from 6.7 percent in Nevada to 0.2 percent in Nebraska (table 1), according to statistics released today by the U.S. Bureau of Economic Analysis (BEA). Current-dollar GDP increased in 49 states and the District of Columbia. For the year 2023, real, or inflation-adjusted, GDP also increased in 49 states and the District of Columbia.
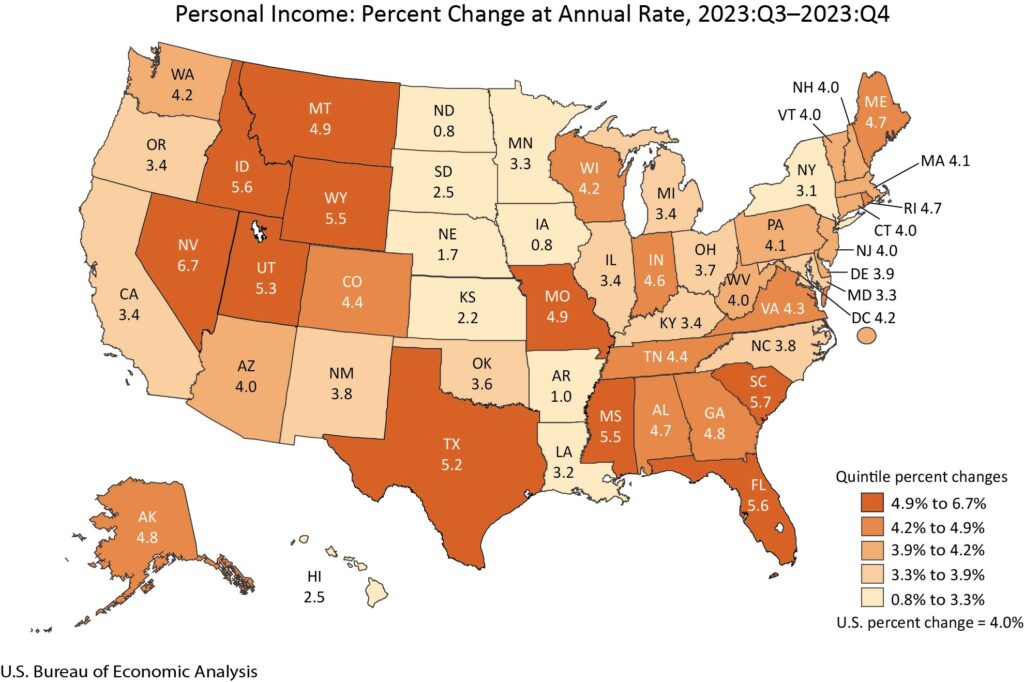
Personal income, in current dollars, increased in all 50 states and the District of Columbia in the fourth quarter of 2023, with the percent change ranging from 6.7 percent in Nevada to 0.8 percent in Iowa and North Dakota (table 4). For the year 2023, current-dollar personal income also increased in all 50 states and the District of Columbia.
Quarterly GDP
In the fourth quarter of 2023, real GDP for the nation grew at an annual rate of 3.4 percent. Real GDP increased in 18 of the 23 industry groups for which BEA prepares quarterly state estimates (table 2). Nondurable-goods manufacturing, retail trade, and durable-goods manufacturing were the leading contributors to growth in real GDP nationally.
- Construction, which increased in 45 states and the District of Columbia, was the leading contributor to growth in 3 states including Nevada, the state with the largest increase in real GDP.
- Agriculture, forestry, fishing, and hunting, which increased nationally and in 32 states, was the leading contributor to growth in Idaho, the state with the second-largest increase in real GDP. In contrast, this industry was the leading offset to growth in Nebraska and Kansas, the states with the smallest increases in real GDP.
- Retail trade, which increased in all 50 states and the District of Columbia, was the leading contributor to growth in 14 states including Utah, the state with the third-largest increase in real GDP.
Annual GDP
In 2023, real GDP for the nation grew at an annual rate of 2.5 percent, with the percent change ranging from 5.9 percent in North Dakota to –1.2 percent in Delaware. Real GDP increased in 17 of the 23 industry groups for which BEA prepares preliminary annual state estimates (table 3). Retail trade; professional, scientific, and technical services; and health care and social assistance were the leading contributors to growth in real GDP nationally.
- Mining increased in 43 states. This industry was the leading contributor to growth in seven states including North Dakota, Texas, Wyoming, Alaska, and Oklahoma, the states with the first-, second-, third-, fourth-, and fifth-largest increases in real GDP, respectively.
- Retail trade increased in all 50 states and the District of Columbia. This industry was the leading contributor to growth in 23 states including Florida, the state with the seventh-largest increase in real GDP.
- Health care and social assistance increased in 49 states and the District of Columbia. This industry was the leading contributor to growth in 6 states.
- Finance and insurance decreased in 43 states and the District of Columbia. The industry was the leading contributor to the decline in Delaware.
Quarterly personal income
In the fourth quarter of 2023, current-dollar personal income increased $229.4 billion, or 4.0 percent at an annual rate (table 4). Increases in earnings and property income (dividends, interest, and rent) were partially offset by a decrease in transfer receipts (chart 1).
Earnings increased in 48 states and the District of Columbia, while growing 4.6 percent nationally (table 5). The percent change in earnings ranged from 8.5 percent in Nevada to –0.8 percent in North Dakota.
- Earnings increased in 20 of the 24 industries for which BEA prepares quarterly estimates (table 6).
- Construction earnings increased in 48 states and the District of Columbia. This industry was the leading contributor to growth in personal income in Nevada and Idaho, the states with the largest and third-largest increases in personal income, respectively.
- In South Carolina, the state with the second-largest increase in personal income, growth in earnings in the construction and professional, scientific, and technical services industries were the leading contributors to the increase in personal income.
- Decreases in farm earnings were the leading offsets to growth in Iowa and North Dakota, the states with the smallest increases in personal income.
Property income increased in all 50 states and the District of Columbia, while growing 6.7 percent nationally. The percent change ranged from 8.8 percent in Florida to 4.7 percent in Iowa and Mississippi (table 5).
Transfer receipts decreased in 32 states and the District of Columbia, while declining 0.7 percent nationally. The percent change in transfer receipts ranged from 8.1 percent in Mississippi to –5.0 percent in Arizona (table 5).
Annual personal income
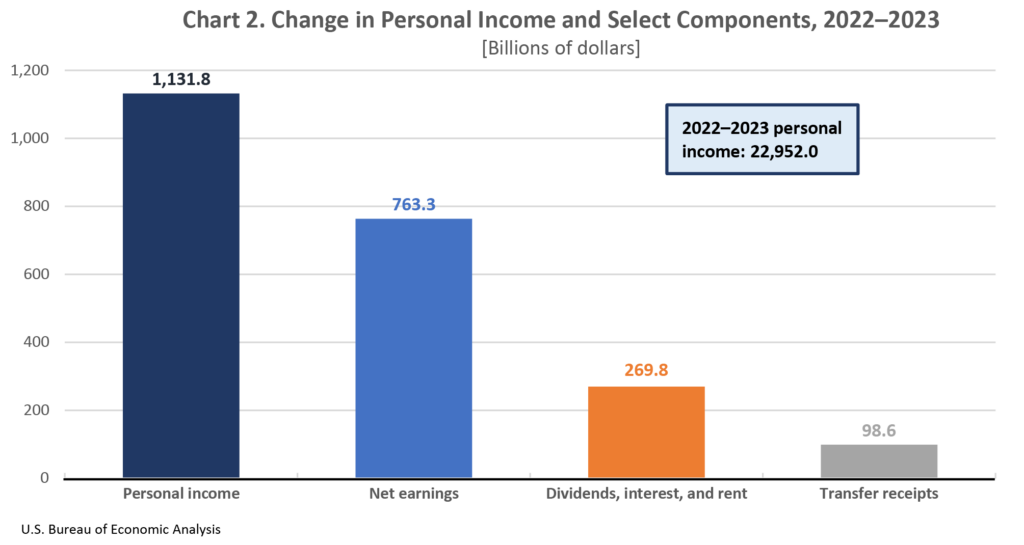
In 2023, personal income for the nation increased at an annual rate of 5.2 percent, with the percent change ranging from 7.0 percent in Florida to 3.4 percent in Indiana.
Nationally, increases in earnings, property income, and transfer receipts contributed to the increase in personal income (chart 2).

Earnings increased in all 50 states and the District of Columbia, while growing 5.6 percent nationally. The percent change in earnings ranged from 8.5 percent in Alaska to 4.0 percent in Mississippi (table 7).
- Earnings increased in 21 of the 24 industries for which BEA prepares annual estimates (table 8).
- In Florida, the state with the largest increase in personal income, growth in earnings in the professional, scientific, and technical services and in the health care and social assistance industries were the leading contributors to the increase in personal income.
- In Utah and Wyoming, the states with the second- and third-largest increases in personal income, growth in earnings in state and local government was the leading contributor to the increase in personal income.
Property income increased in all 50 states and the District of Columbia, while growing 6.3 percent nationally. The percent change ranged from 9.0 percent in Idaho to 2.7 percent in Iowa (table 7).
Transfer receipts increased in 45 states and the District of Columbia, while growing 2.5 percent nationally. The percent change in transfer receipts ranged from 7.3 percent in the District of Columbia to –8.9 percent in Alaska (table 7).
Update of state statistics
BEA revised quarterly estimates of personal income by state for the first quarter of 2023 through the third quarter of 2023. New estimates of per capita personal income for the fourth quarter of 2023, along with revised estimates for the first quarter of 2020 through the third quarter of 2023.
BEA used U.S. Census Bureau (Census) population figures to calculate per capita personal income estimates for the first quarter of 2020 through the fourth quarter of 2023. BEA also used new Census population figures to update annual 2020 to 2022 per capita personal income statistics and to produce new per capita personal income statistics for 2023.


