Post-pandemic Latin American immigration and the unemployment rate (and it’s implications for the economy) – by New Deal democrat One week ago, in analyzing the jobs report, I noted the continuing severe disconnect between the Establishment Survey, which continues to show strong growth, and the Household Survey, which has been downright recessionary. I expanded on that analysis Monday and Tuesday, noting that “At the end of Q4 2022, the Establishment Survey showed gains of 3.0% YoY. By the end of 2023, that had declined to 2.0%. Meanwhile, over the same period the YoY gains in the Household Survey had declined from 2.0% to 1.2%.” Meanwhile, the comprehensive QCEW, showed a YoY deceleration from 2.8% in Q4 2022 to 1.5% at the end of Q4 2023.
Topics:
NewDealdemocrat considers the following as important: immigration
This could be interesting, too:
Angry Bear writes Immigrants and the Makeup of the US Workforce
Joel Eissenberg writes Annals of “government efficiency”
Eric Kramer writes Somebody better call DOGE . . .
Joel Eissenberg writes Trump takes NYC hostage
Post-pandemic Latin American immigration and the unemployment rate (and it’s implications for the economy)
– by New Deal democrat
One week ago, in analyzing the jobs report, I noted the continuing severe disconnect between the Establishment Survey, which continues to show strong growth, and the Household Survey, which has been downright recessionary.
I expanded on that analysis Monday and Tuesday, noting that “At the end of Q4 2022, the Establishment Survey showed gains of 3.0% YoY. By the end of 2023, that had declined to 2.0%. Meanwhile, over the same period the YoY gains in the Household Survey had declined from 2.0% to 1.2%.” Meanwhile, the comprehensive QCEW, showed a YoY deceleration from 2.8% in Q4 2022 to 1.5% at the end of Q4 2023.
In other words, the Establishment Survey may have been overstating growth, while the Household Survey was likely understating it.
The cause of the underestimate of growth in the Household Survey seems most likely to be a big undercount of post-pandemic immigration. Here’s the math I wrote up on Tuesday:
“In the past two years through May, according to the Census Bureau, the US population has grown by a little over 1%. But according to the Congressional Budget Office, it has grown slightly over 2%. That’s over a 3,000,000 difference!”
If we make the reasonable assumptions that this big surge of immigrants has been from Latin America, and much more closely resembles the prime working age demographic of 25-54 years than the native population, applying those adjustments yields an estimate of an additional 2,000,000 employed through May 2024 vs. official Household Survey numbers.
That left one important caveat, namely: “if the Household Survey has been underestimating prime working age population growth, adjusting for that solves most of the discrepancy with the Establishment Survey. But note that the above analysis only addresses *employment,* and not the unemployment rate.” That’s what I want to take a look at now.
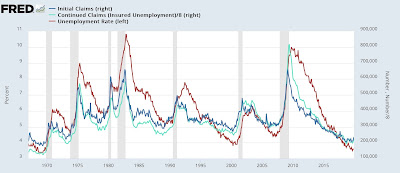
Let me start by reiterating that initial jobless claims have had a 60-year history of leading the unemployment rate. Here’s the historical look from the 1960s until just before the pandemic:
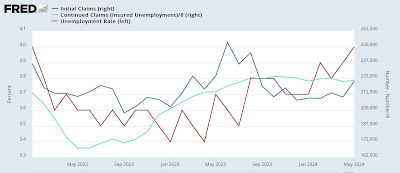
In the first several years after the pandemic, that relationship held true. But over the past six months or so, the unemployment rate has continued to drift up even as initial claims declined from last summer through April, and continuing claims stabilized:
It is interesting that something similar happened during the two “jobless” recoveries following the 1991 and 2001 recessions. The unemployment rate continued to rise for an extended period after both initial and continuing jobless claims declined.
The most likely explanation for an increasing number of unemployed is that their jobless benefits expired. Thus, they were no longer counted as “continuing claims” but continued to be jobless. No such lackluster recovery has been in evidence post-pandemic.
But a similar dynamic may be in play. That’s because *new* entrants to the labor force who fail to find their first job will not show up in unemployment claims; but they will show up in the unemployment rate. There is a big historical precedent for this involving the Baby Boom which I’ll save for another day.
But for now, consider that if, properly adjusted, the unemployment rate has not risen, because Latin American immigrants are filling all the jobs that native born workers are not, then we should see that their unemployment rate will remain constant, vs. that for White or Black native-born populations.
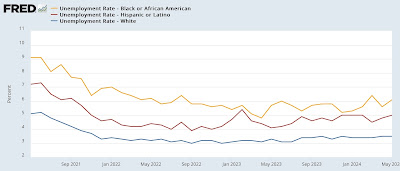
But that’s not what we see. The unemployment rates for Whites, Blacks, and Latin Americans have all risen. For Whites it has risen from 3.1% to 3.5%, for Blacks from 4.8% to 6.1%, and for Latin Americans from 3.9% to 5.0%:
Indeed, the decline in the unemployment rate for Latin Americans was especially sharp in 2021 and 2022, suggesting that they were filling a disproportionate number of the openings advertised by the ubiquitous “help wanted” signs during that time.
That the unemployment rate for this ethnic group, which presumably includes the vast majority of recent immigrants, has risen much more sharply than for Whites, and almost as sharply as for Blacks, implies that a small but increasing percentage of these new immigrants are not finding employment. These unemployed recent immigrants did not previously hold a job in the US, and so do not show up in jobless claims – but do show up in the Household Survey’s unemployment rate.
This in turn has implications for whether the economy is as close as the Household Survey suggests to recession or not. Because the picture it paints is that of an economy that is still growing, perhaps even strongly, but not quite as strongly as before, and so not as able to absorb the full influx of 6,000,000 (!) immigrants in two years.
For that reason, I think it is fair to continue to put more weight on the Establishment Survey’s showing of continued growth in the economy.
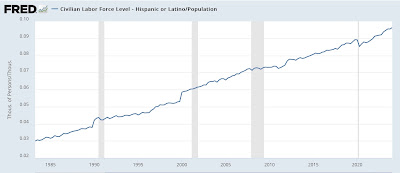
Finally, here is the graph of the long-term growth in the Hispanic or Latino population:
Notice the big bumps after the 1990 and 2000 Censuses? That corrected for a chronic undercount during both of those decades. Indeed, it was the subject of a Fed white paper about an undercount in the Household Survey in 1999. But there was no such bump in the immediate aftermath of the “Great Recession,” which put a damper on immigration. Similarly, the post-pandemic increase in immigration did not occur until after the 2020 Census took place. In other words, the chronic undercount of recent Latin American immigrants in the workforce may continue all the way up until the 2030 Census.
The Bonddad Blog
What would adjusting the Household jobs Survey for immigration driven population growth do? Angry Bear, by New Deal democrat


