Keep in mind, the chart we presented a while back, a comparison of how healthcare expenses compare to GDP or take of GDP to pay for it. Still less than 18%. What you are looking at is a finer breakdown of the healthcare costs. What do we want to improve? Healthcare spending in the U.S. increased by 4.1% in 2022 to .4 trillion or ,493 per capita. This growth rate is comparable to pre-pandemic rates (4.1% in 2019). Although government spending to manage the pandemic led to substantial increases in NHE, these expenditures significantly declined in 2021. Utilization of medical goods and services did rebound. By 2022, top-level patterns in health spending more closely resembled the pre-pandemic period. The 2022 Health Care Cost and Utilization
Topics:
Angry Bear considers the following as important: Health Care Cost Institute, Healthcare
This could be interesting, too:
Bill Haskell writes Families Struggle Paying for Child Care While Working
Joel Eissenberg writes RFK Jr. blames the victims
Joel Eissenberg writes The branding of Medicaid
Bill Haskell writes Why Healthcare Costs So Much . . .
Keep in mind, the chart we presented a while back, a comparison of how healthcare expenses compare to GDP or take of GDP to pay for it. Still less than 18%. What you are looking at is a finer breakdown of the healthcare costs. What do we want to improve?
Healthcare spending in the U.S. increased by 4.1% in 2022 to $4.4 trillion or $13,493 per capita. This growth rate is comparable to pre-pandemic rates (4.1% in 2019). Although government spending to manage the pandemic led to substantial increases in NHE, these expenditures significantly declined in 2021. Utilization of medical goods and services did rebound. By 2022, top-level patterns in health spending more closely resembled the pre-pandemic period.
The 2022 Health Care Cost and Utilization Report presents data on health care spending, utilization, and average prices from 2018 through 2022 for individuals under the age of 65 who receive health insurance coverage through an employer. The report relies on commercial health insurance claims contributed by CVS Health/Aetna, Humana, and Blue Health Intelligence during this period. The key findings are:
This report examines trends across inpatient admissions; outpatient services; professional (i.e., physician and other clinician) services; and prescription drugs, though prescription drug spending does not reflect manufacturer rebates. We also look at granular trends within each category. All data were weighted to reflect the age, gender, and geographic mix of the employer-sponsored insurance (ESI) population by year. We do not adjust for changes in the composition of services provided over time in our main report. We believe the racial and ethnic distribution of the population in HCCI’s data is similar to the national ESI population. Nationally, Black, American Indian and Alaska Native, and Hispanic populations are under-represented in ESI, so health care costs and use among these groups are likely under-represented in this report’s findings.

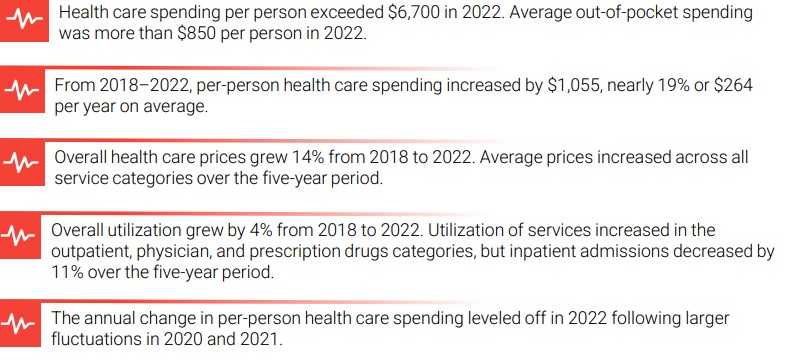
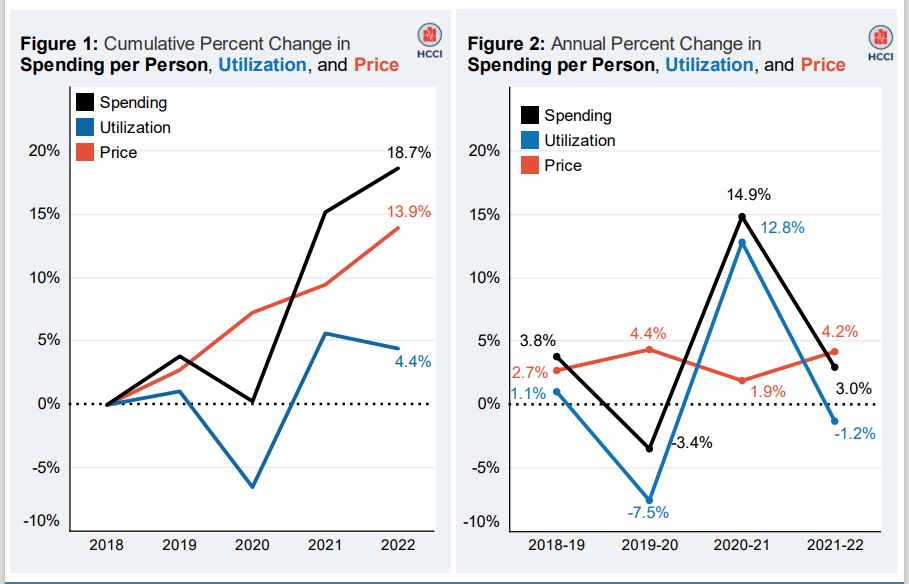
In 2022, per person spending among people with employer-sponsored insurance (ESI) exceeded $6,700. From 2018 to 2022, spending per person increased by $1,055 from $5,656 to $6,711 (nearly 19%). As shown in Figure 1, the increase in spending was driven by rising average prices. It grew by 14%. During this period, there was also a cumulative 4% increase in use.
Annual spending per person increased each year from 2018 to 2022 except for 2019 to 2020, which was affected by COVID-19 pandemic. Figure 2 shows that the largest annual increase in spending per person during this time was from 2020–21 (14.9%), reflecting the lower per-person spending in 2020. Annual changes in utilization fluctuated over the five-year window, decreasing from 2019-20 (-7.5%) and again in 2021–22 (-1.2%) following a dramatic increase in use from 2020–21 (12.8%). Average prices grew each year from 2018 to 2022 with annual growth ranging from almost 2% (2020–21) to more than 4% (2019–20 and 2021–22).
We adjusted spending, utilization, and enrollment using ESI weights based on age, sex, and geography to develop estimates that were representative of the national ESI population younger than 65.

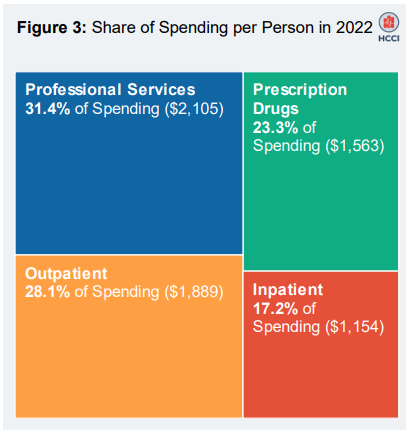
Annual spending per person grew to $6,711 in 2022, an increase of nearly 19% from 2018. As shown in Figure 3, professional services made up the largest share of per person spending. This was followed by outpatient visits and procedures, prescription drugs, and inpatient admissions. The proportion of per person spending by these four categories has remained relatively consistent over time. Note, the spending on prescription drugs does not account for manufacturer rebates.
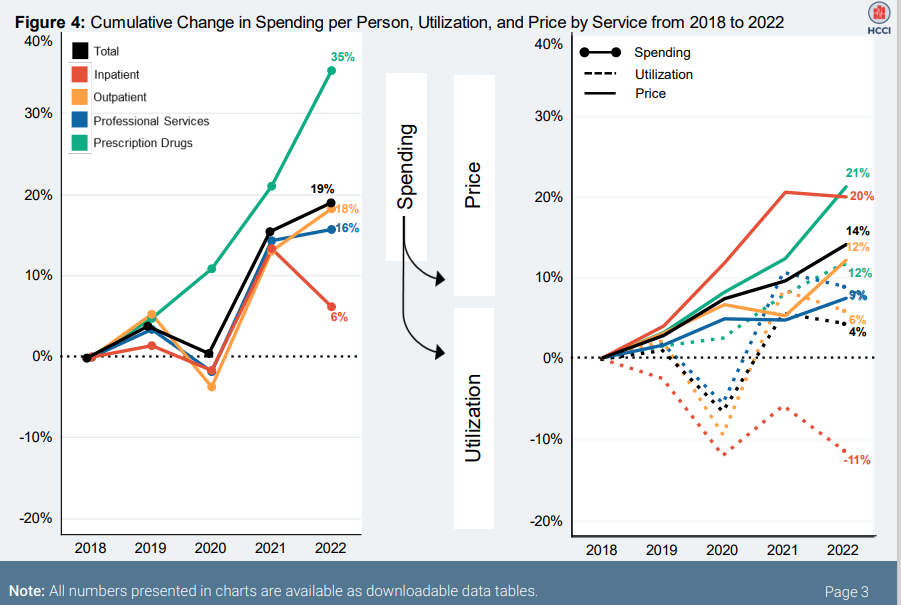
Figure 4 shows how average prices and utilization contribute to per-person spending growth by category. Spending increases were largely driven by rising prices. Between 2018 and 2022, average prices increased (14%) overall. Among medical services, average prices for inpatient and outpatient care increased by double digits over the five-year period while prices for professional services increased from 2018–22 by 7%. Average point-of-sale prices for prescription drugs grew by just over 20%; rebates likely offset a meaningful amount of this growth. Note: All numbers presented in charts are available as downloadable data tables. Page 3
Across the service categories, utilization increased by 4% over the five-year period. Inpatient services experienced the only cumulative decrease in use (-11%). In contrast, use of prescription drugs (12%), professional services (8%), and outpatient services (6%) all increased from 2018 to 2022.

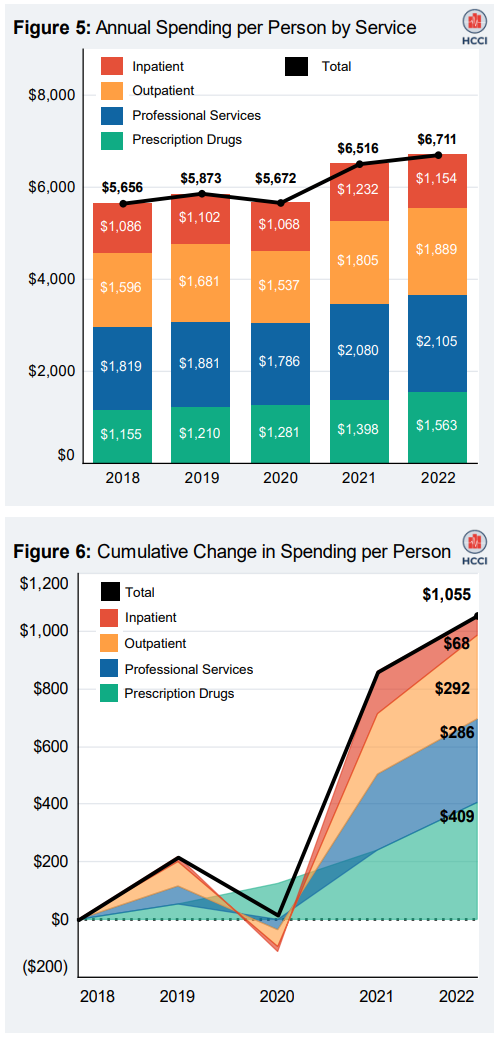
Except for a decline from 2019 to 2020, total per-person spending increased each year from 2018 through 2022, as shown in Figure 5. Spending increased $1,055 per person over the five-year period, an average of $264 per year.
Per person spending in 2022 was higher than in 2018 across all service categories.
Figure 6 highlights the growth in each service category. Gross spending on prescription drugs increased $409 per person over five years. This is the largest increase over the five-year period, but the total does not reflect manufacturer rebates, which would offset some of this growth.
Per person spending on facility payments for outpatient services was the category with the second highest increase over the five years. The Per person outpatient spending increased $292 per person from 2018 to 2022.
Per person spending on professional services increased $286 per person over five years, reaching more than $2,100 in 2022.
Spending on facility payments for inpatient admissions increased $68 per person over five years, the smallest increase of the four major categories.
Figure 6 shows that per-person spending was increasing from 2018 to 2019, decreased dramatically from 2019 to 2020, and has increased since.