The IEA report covers a February-to-February timeframe 2023 – 2024. When the IEA speaks of evolution, they are reviewing the OECD usage and direction for 13 months. There is a brief summation in the beginning for Fossil Fuel. Renewable Sources, and Nuclear power production. The charts tell the rest of the story for the OECD associated countries. Organization for Economic Cooperation and Development Electricity Production, IEA (2024), Monthly Electricity Statistics, IEA, Paris In February 2024, the total net electricity production in total OECD reached 869.1 TWh, marking a 2.3% increase compared to the same period last year. Fossil Fuels Electricity generation from fossil fuels amounted to 397.3 TWh in February 2024, exhibiting a decline
Topics:
Angry Bear considers the following as important: climate change, OECD, US/Global Economics
This could be interesting, too:
Joel Eissenberg writes How Tesla makes money
Angry Bear writes True pricing: effects on competition
Angry Bear writes The paradox of economic competition
Angry Bear writes USMAC Exempts Certain Items Coming out of Mexico and Canada
The IEA report covers a February-to-February timeframe 2023 – 2024. When the IEA speaks of evolution, they are reviewing the OECD usage and direction for 13 months. There is a brief summation in the beginning for Fossil Fuel. Renewable Sources, and Nuclear power production. The charts tell the rest of the story for the OECD associated countries.
Organization for Economic Cooperation and Development Electricity Production, IEA (2024), Monthly Electricity Statistics, IEA, Paris
In February 2024, the total net electricity production in total OECD reached 869.1 TWh, marking a 2.3% increase compared to the same period last year.
Fossil Fuels
Electricity generation from fossil fuels amounted to 397.3 TWh in February 2024, exhibiting a decline of 5.2% (equivalent to 21.8 TWh) compared to February 2023. The reduction as largely driven by lower electricity output from coal. Use of coal experienced an 8.3% year-on-year decrease, followed by gas with a decrease of 3.3% year-on-year. The decrease in coal-fired electricity generation was evident across all OECD regions, with OECD Europe experiencing the most significant decline at 20.3% year-on-year, followed by OECD Asia Oceania at 4.0% year-on-year and the OECD Americas at 3.3% year-on-year. The drop in natural gas electricity production was observed in OECD Europe (-26.4% y-o-y1) and OECD Asia Oceania (-3.5% y-o-y), whereas the OECD Americas witnessed a 5.9% y-o-y increase. Overall, fossil fuels accounted for 45.7% of the electricity mix.
Renewable Sources
Electricity production from renewable sources increased by 11.4% y-o-y at 320.0 TWh in February 2024. This growth was primarily driven by increased electricity generation from wind power, with OECD Europe leading the trend with a notable 29.8% year-on-year increase, equivalent to 15.1 TWh. Hydropower generation also experienced a significant rise of 9.8% year-on-year, driven by increased output in OECD Europe (+34.4% y-o-y) and OECD Asia Oceania (+21.9% y-o-y), although it declined in the OECD Americas by 7.9% year-on-year. Solar power generation continued its upward trend, with significant increases observed in the OECD Americas (+30.4% y-o-y) and in OECD Europe (+9.9% y-o-y). Overall, renewables sources contributed 36.8% to total electricity production in February 2024, marking an increase of 3 percentage points compared to the same month in the previous year.
Nuclear
Nuclear electricity production reached 149.2 TWh in February 2024, reflecting a 6.0% increase compared to the same month last year. This growth was attributable to increased nuclear output across all OECD regions, with the OECD Americas leading with a 5.4% year-on-year increase, followed by OECD Asia Oceania (+13.2% y-o-y) and OECD Europe (+4.2% y-o-y). Overall, nuclear power contributed 17.2% to the electricity mix.
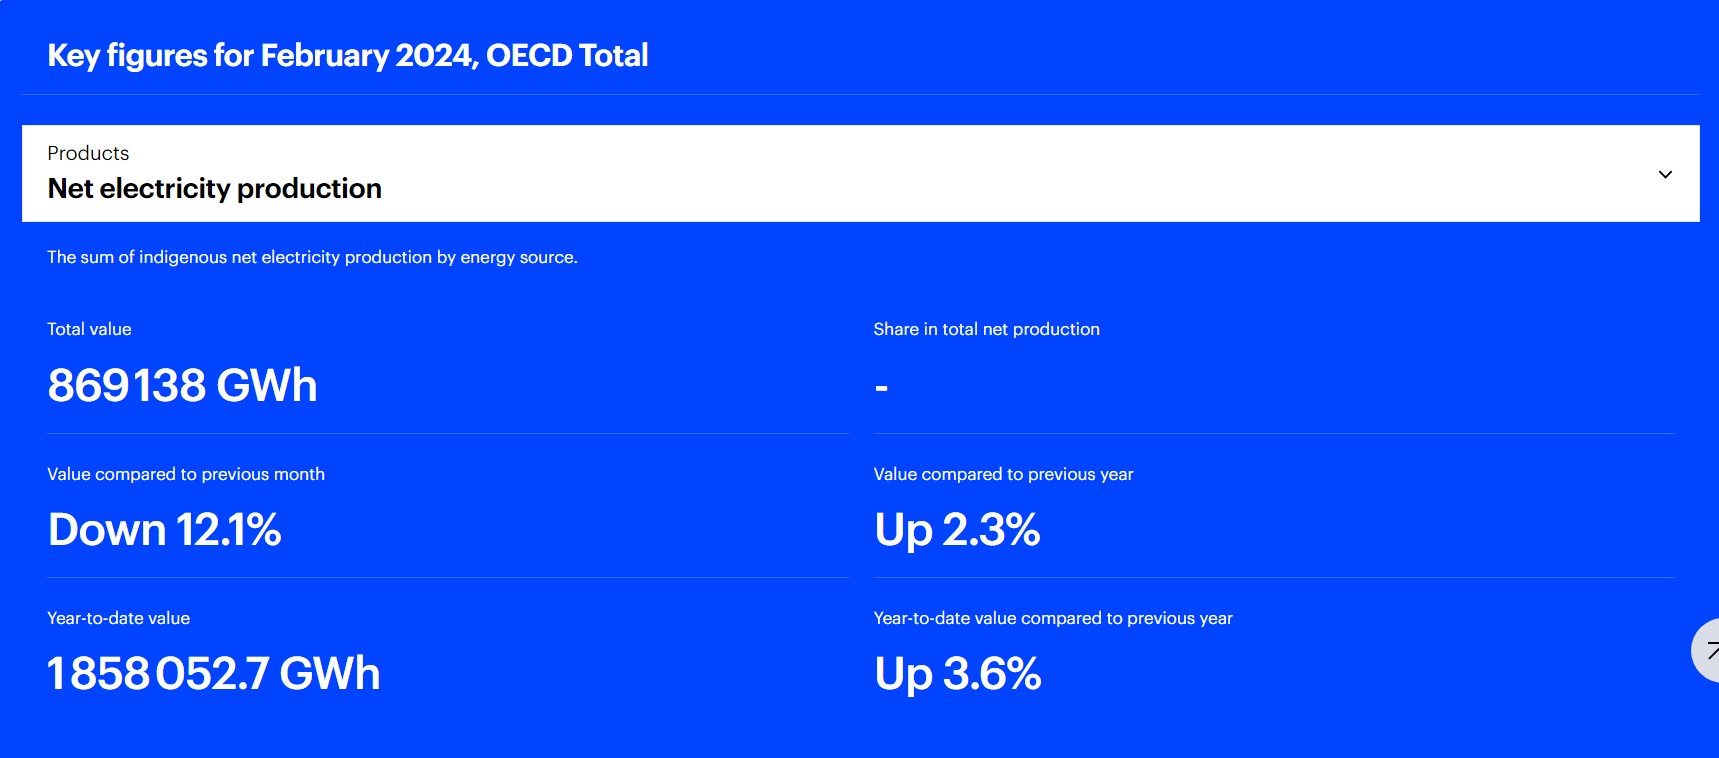
Key Figures for February 2024 Report

Electricity Production Evolution
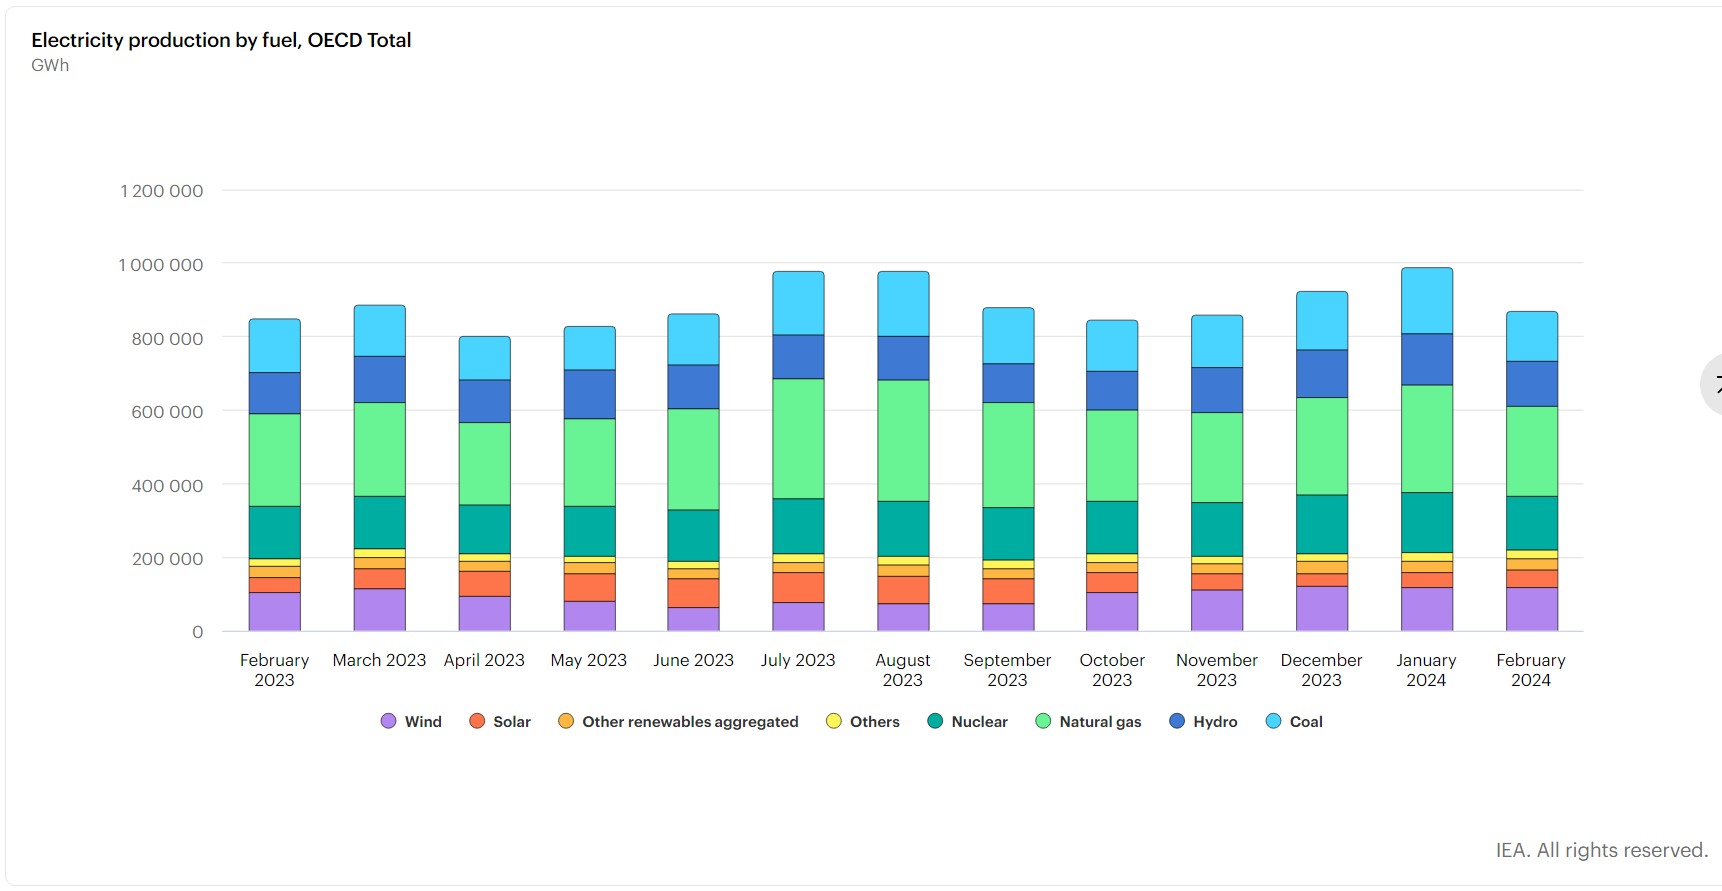
Electricity Production by Fuel Usage
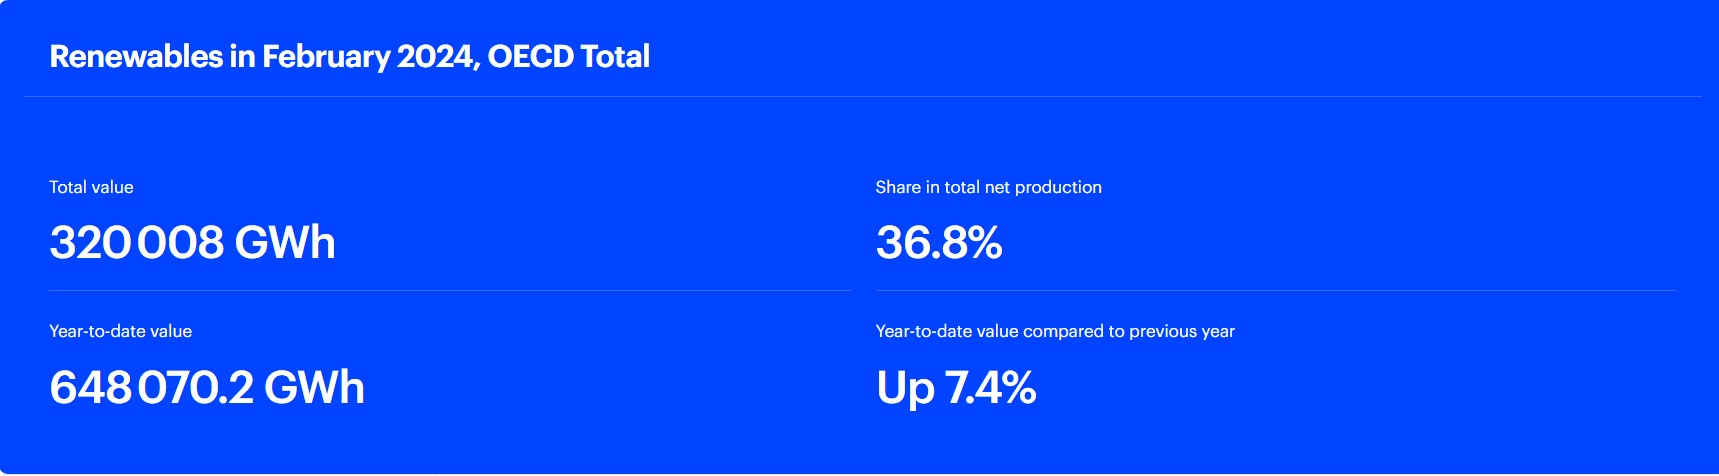
Renewable Usage in February 2024

Evolution of Renewables and Non-Renewable Power Production
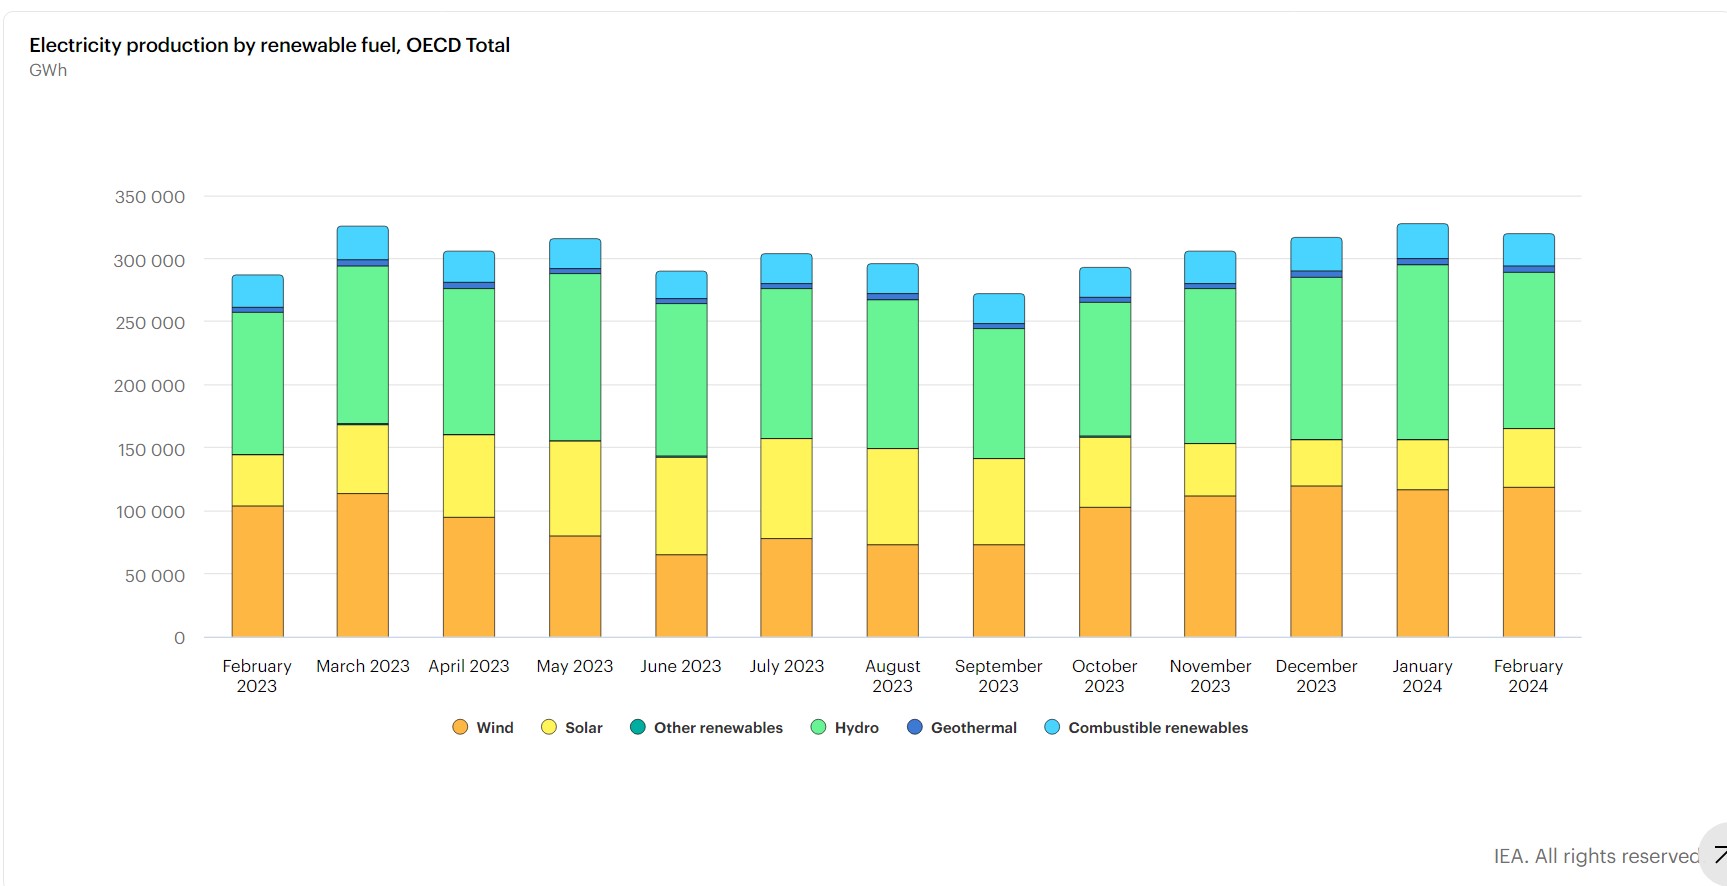
Electricity Production by Renewable Fuel
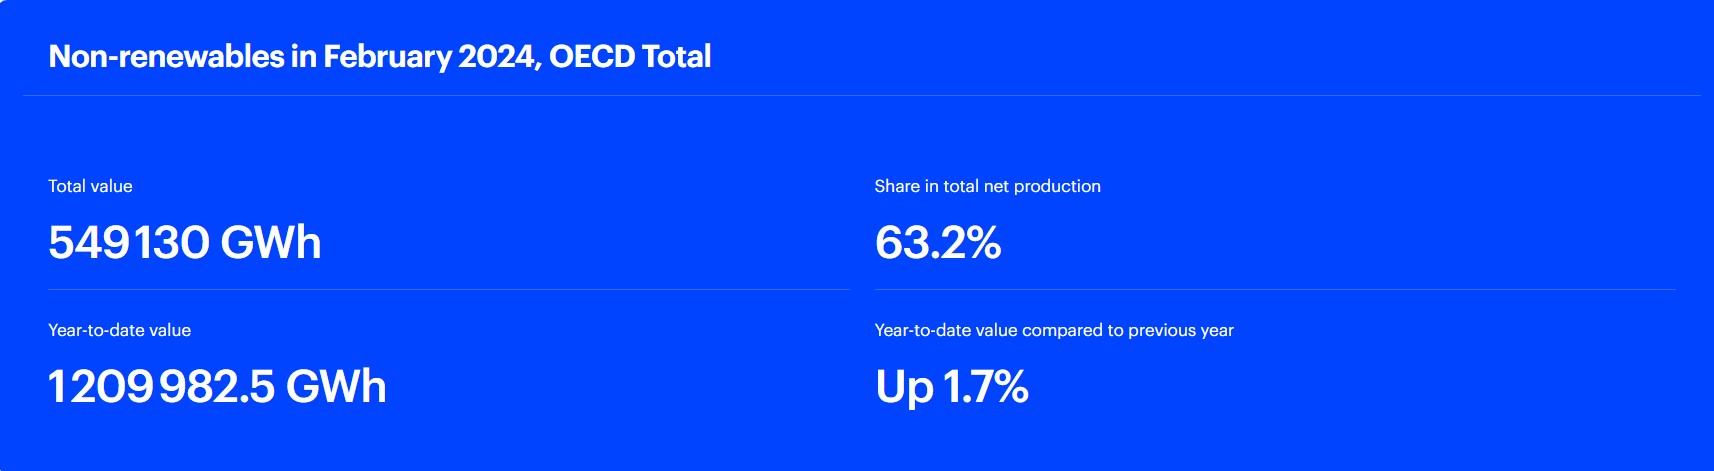
Non-Renewables Usage February 2024
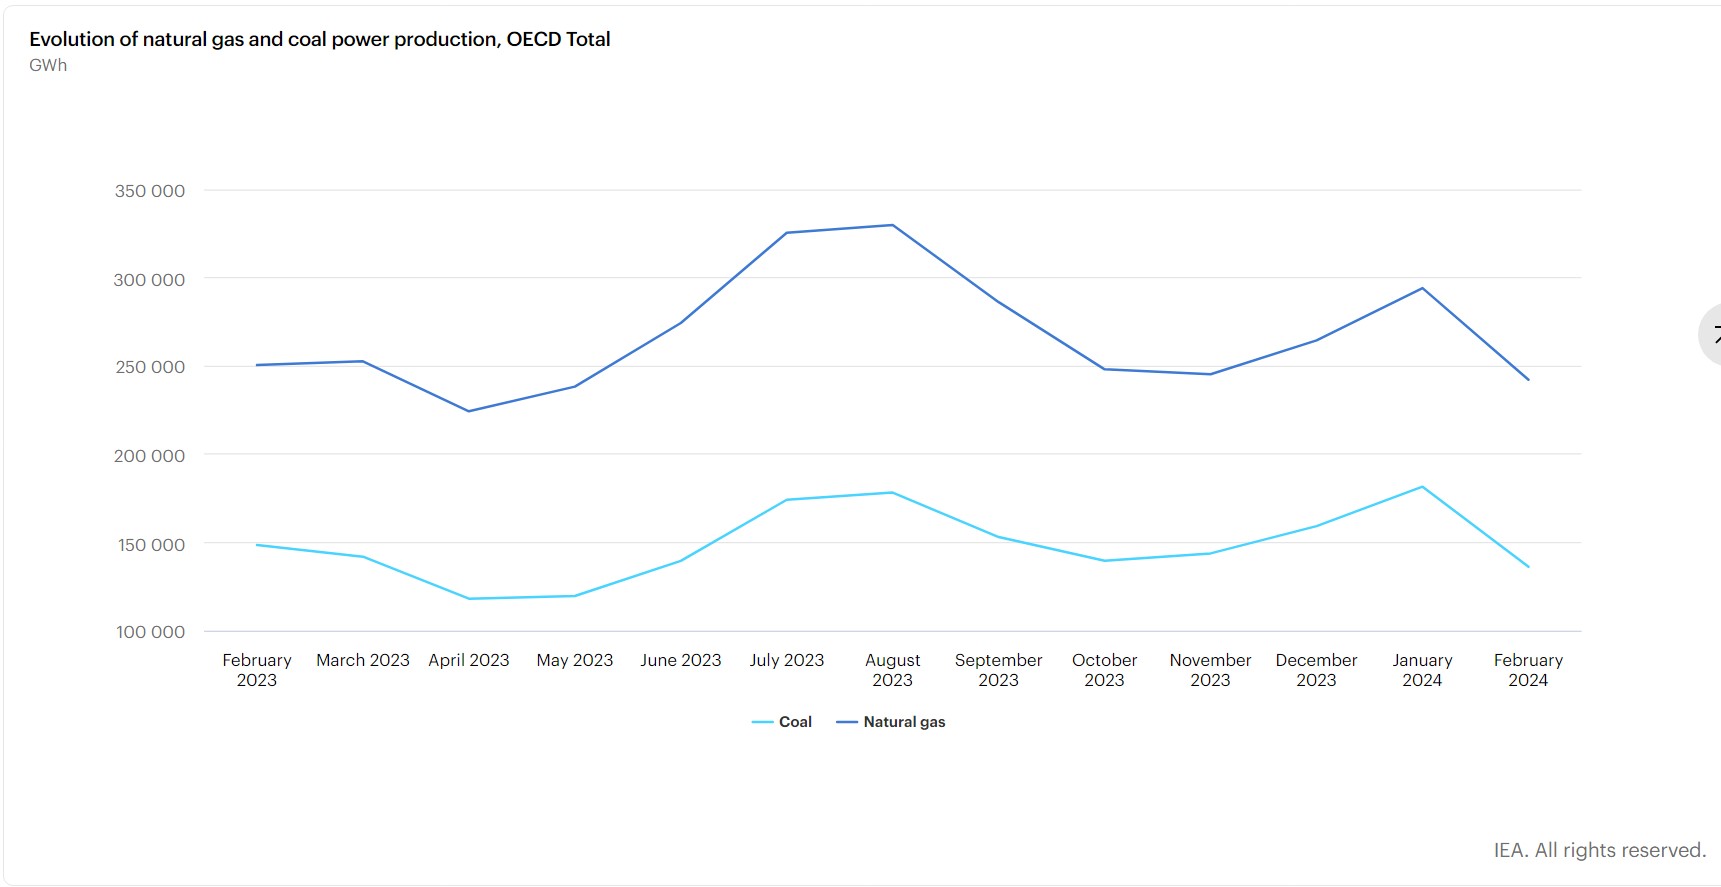
Evolution of Natural Gas and Coal Power Production
Evolution of Fossil Fuel and Nuclear Power Production