It appears people will argue the economic and social positives of the different political parties over periods of time. They probably are different. So, EPI has managed to chart the differences. What the first four charts do is detail the differences between the two parties over two different time periods. One time period staring in 1949 and the next time period in 1981. A contrast in beliefs? Maybe . . . The last two Appendix Charts compare presidencies and their differences in Growth and Distribution (based on income) results. I am sure many of you will flock to those comparisons. I thought they were interesting. Maybe you will also. Economic performance is stronger when Democrats hold the White House” by Josh Bivens Economic
Topics:
Angry Bear considers the following as important: history, Political Party Economic Differences, politics, US EConomics
This could be interesting, too:
Robert Skidelsky writes Lord Skidelsky to ask His Majesty’s Government what is their policy with regard to the Ukraine war following the new policy of the government of the United States of America.
NewDealdemocrat writes JOLTS revisions from Yesterday’s Report
Joel Eissenberg writes No Invading Allies Act
Ken Melvin writes A Developed Taste
It appears people will argue the economic and social positives of the different political parties over periods of time. They probably are different. So, EPI has managed to chart the differences. What the first four charts do is detail the differences between the two parties over two different time periods. One time period staring in 1949 and the next time period in 1981. A contrast in beliefs? Maybe . . .
The last two Appendix Charts compare presidencies and their differences in Growth and Distribution (based on income) results. I am sure many of you will flock to those comparisons.
I thought they were interesting. Maybe you will also.
Economic performance is stronger when Democrats hold the White House”
by Josh Bivens
Economic Policy Institute
Since 1949, there has been a Democratic advantage in the average performance of key macroeconomic indicators measuring economic health.
Summary: The economy performs much better during Democratic presidential administrations than during Republican ones.
- This Democratic advantage is across the board in all variables we measure but strongest in private-sector outcomes—notably, business investment, job growth, and the growth of market-based incomes.
- Household income growth (adjusted for inflation) was faster on average and far more equal during Democratic administrations, and the Democratic advantage shows up for every group.
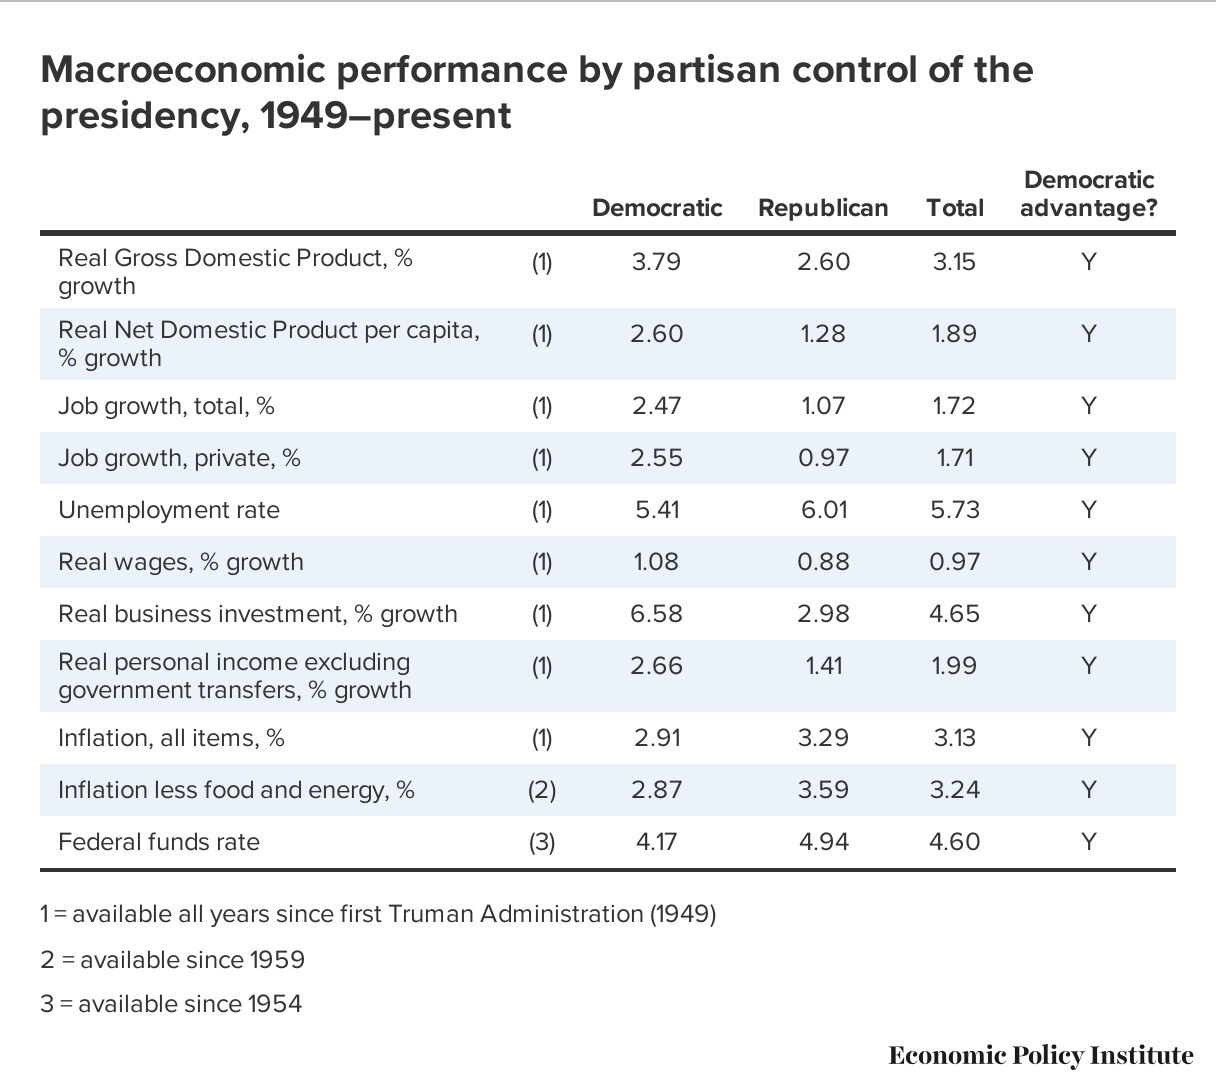
Table 1
Table 1 shows the average performance of a range of key macroeconomic variables under Democratic and Republican administrations since 1949, the beginning of Harry Truman’s first elected term.3 There is a Democratic advantage in every measure.
The next Table or Table Two below shows similar results over a shorter time span. The number should not be taken as the best result that could have been achieved. For example, is “Real Wage Growth” of .64% the best achievement to be had?
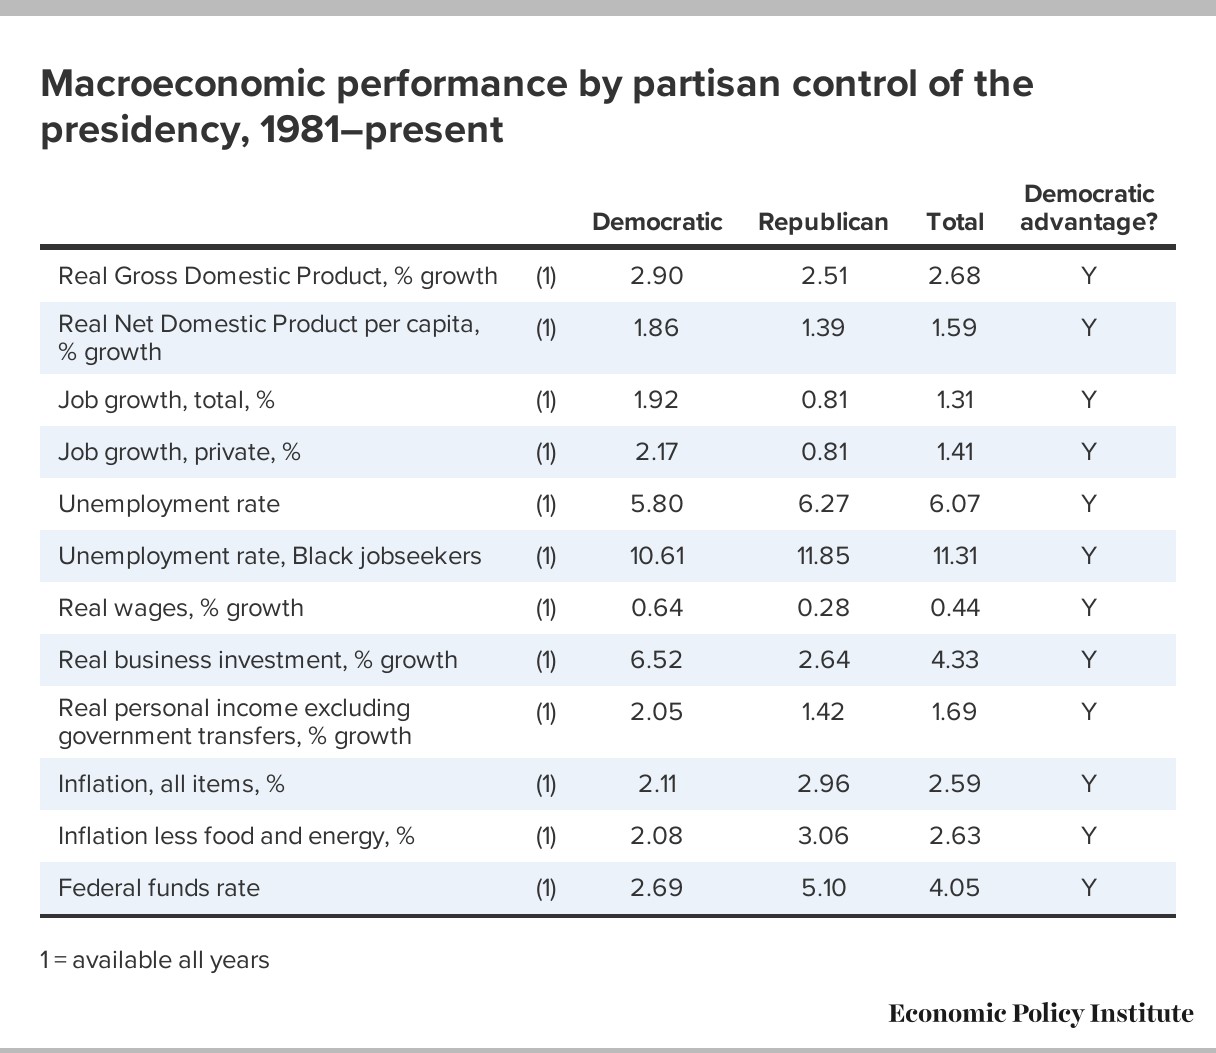
Table 2
Table 2 shows an almost identical set of indicators as Table 1 but measured only since 1981, the first term of the Reagan administration. There are two reasons to look at this set of more recent administrations. First, if the Democratic advantage mostly stems from the performance of very long-past administrations (say that the Kennedy/Johnson administration had superior performance relative to the Eisenhower administration), perhaps many will simply find these comparisons irrelevant.
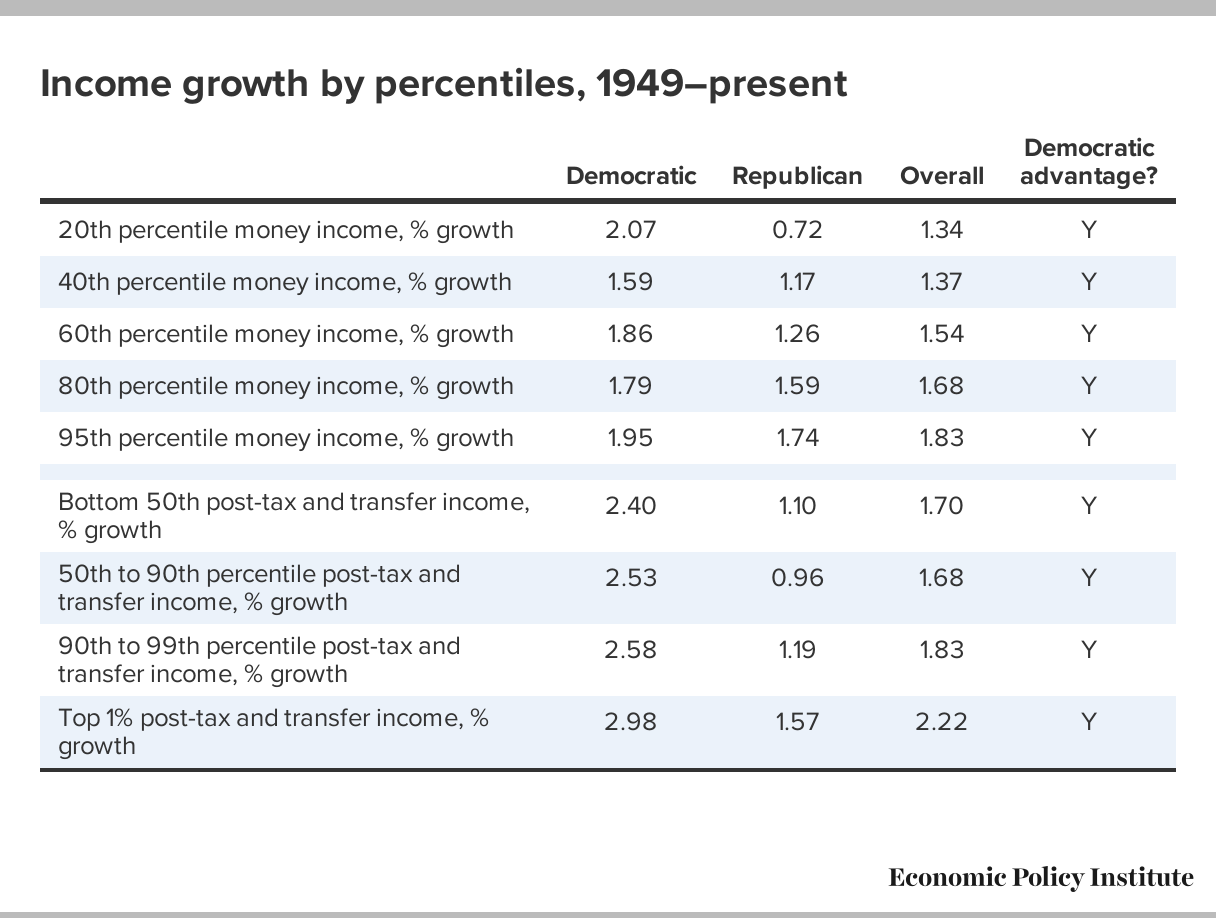
Table 3
In Table 3 is showing income growth over the full post–1948 period. The Census Bureau data shows Democratic advantage in income growth for every percentile measured. The advantage uniformly becomes larger the lower one goes down the income distribution.
For example, income growth for families at the 95th percentile of the income distribution (those making more income than 95% of other families) is about 10% faster during Democratic administrations (1.95% average annual growth compared with 1.74% growth in Republican administrations). But families in the middle fifth of the income distribution see growth that is 48% faster during Democratic administrations (1.9% average annual growth compared with 1.3% growth during Republican administrations). And for families in the bottom fifth of the income distribution, income growth is 188% faster during Democratic administrations (2.1% average annual growth compared with 0.7% growth during Republican administrations).
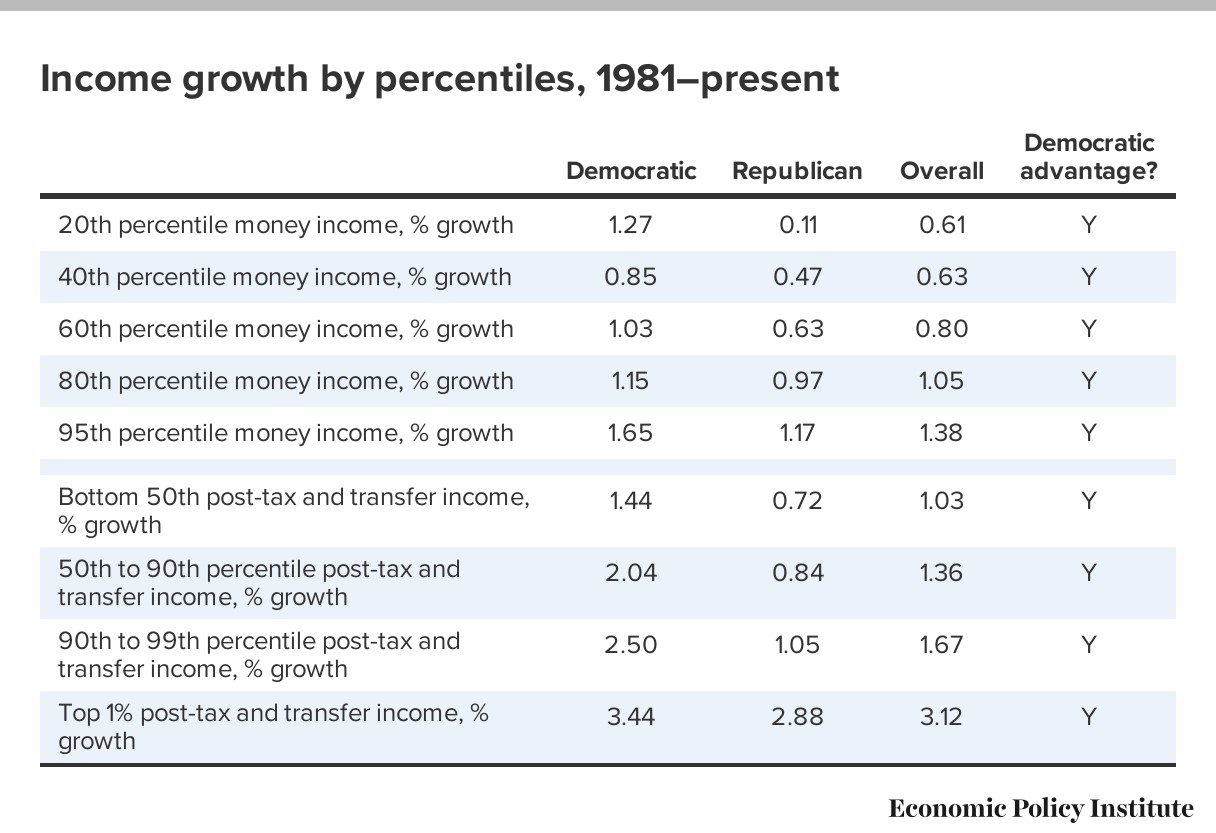
Table 4
Table 4, shows income growth since 1980. Again there is a “Democratic” advantage in pre-tax money income in every income group, By far it is the largest for the lowest income fifth. In the WID data, there is a Democratic advantage in every income group. By far the smallest for the top 1%.
In short, the clear sweep of income trends is that during Democratic control of the White House, overall income rises faster, income for every measured income class rises faster, and income growth is far more equalizing.
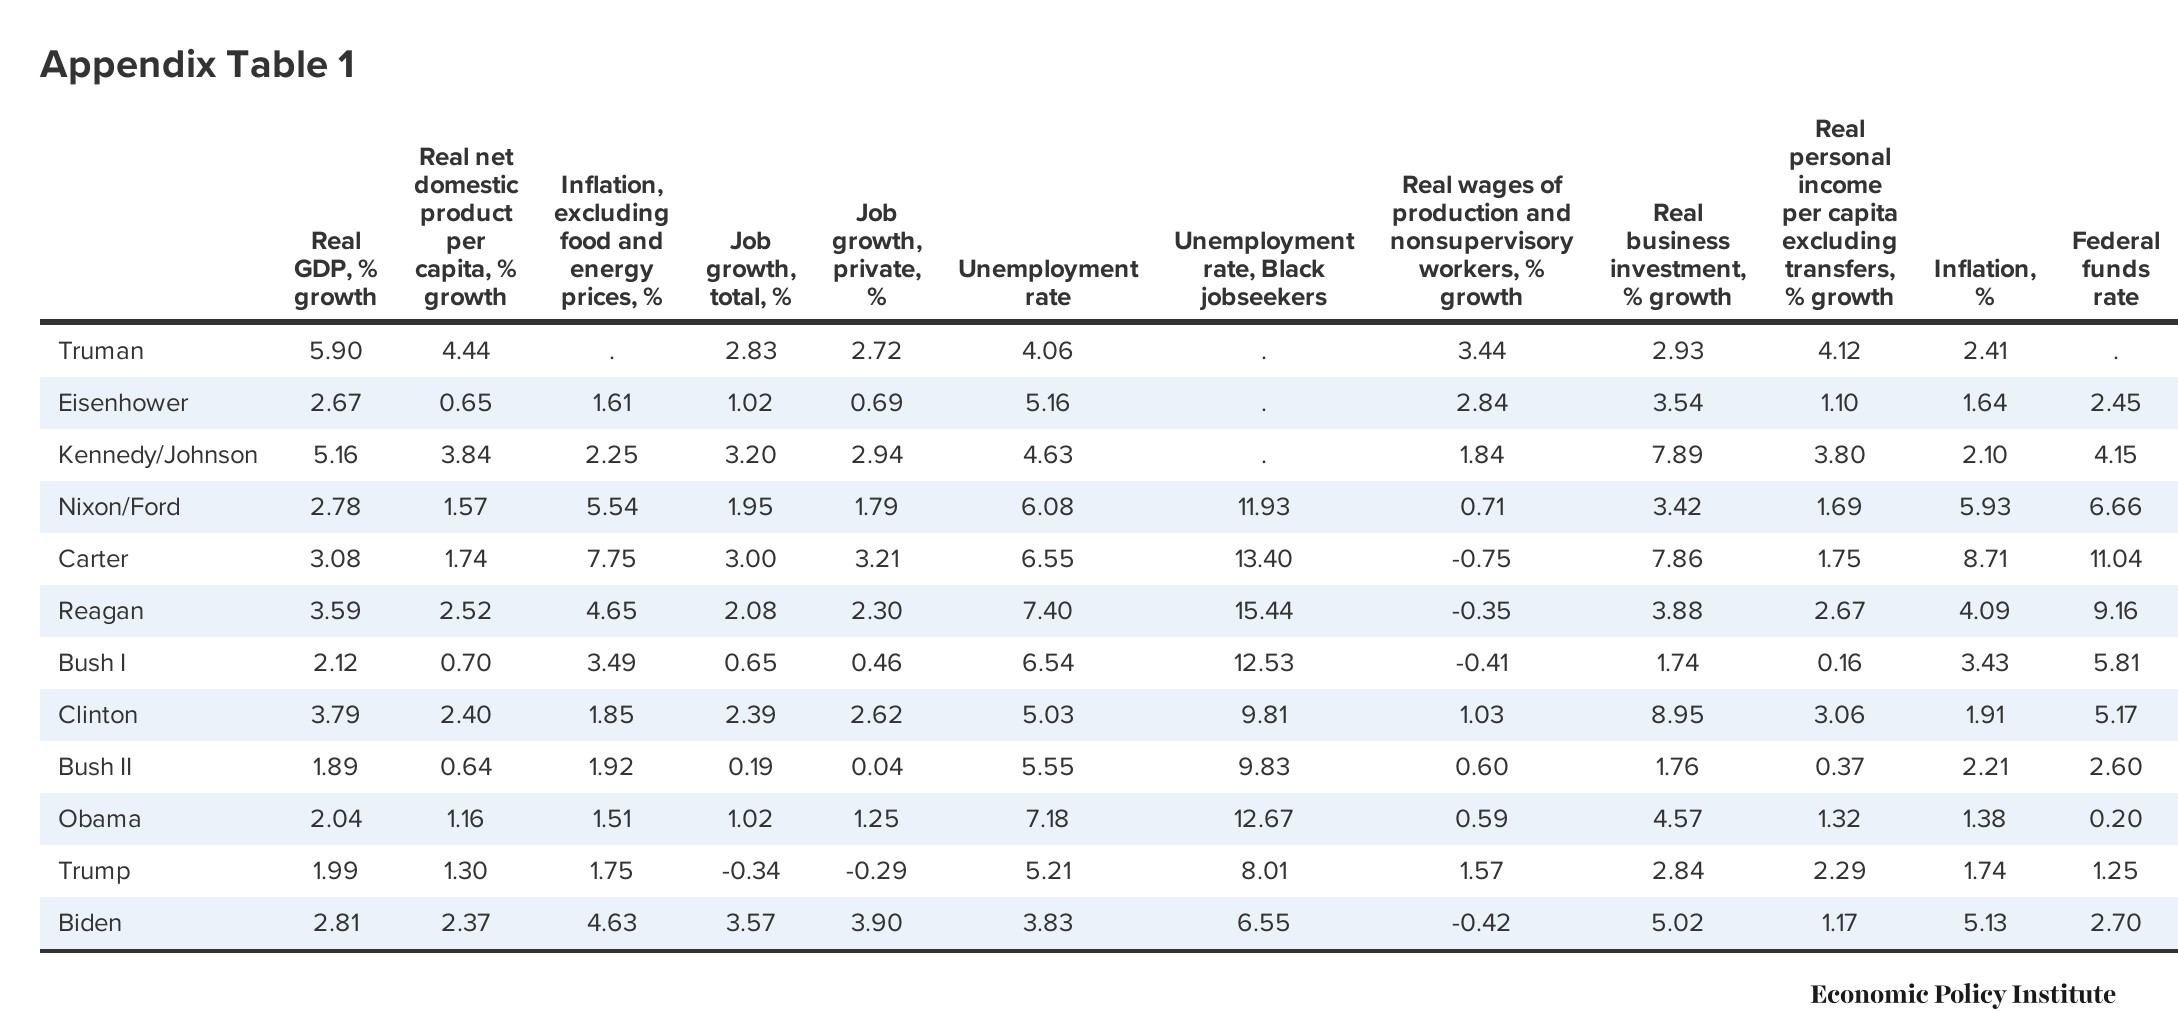
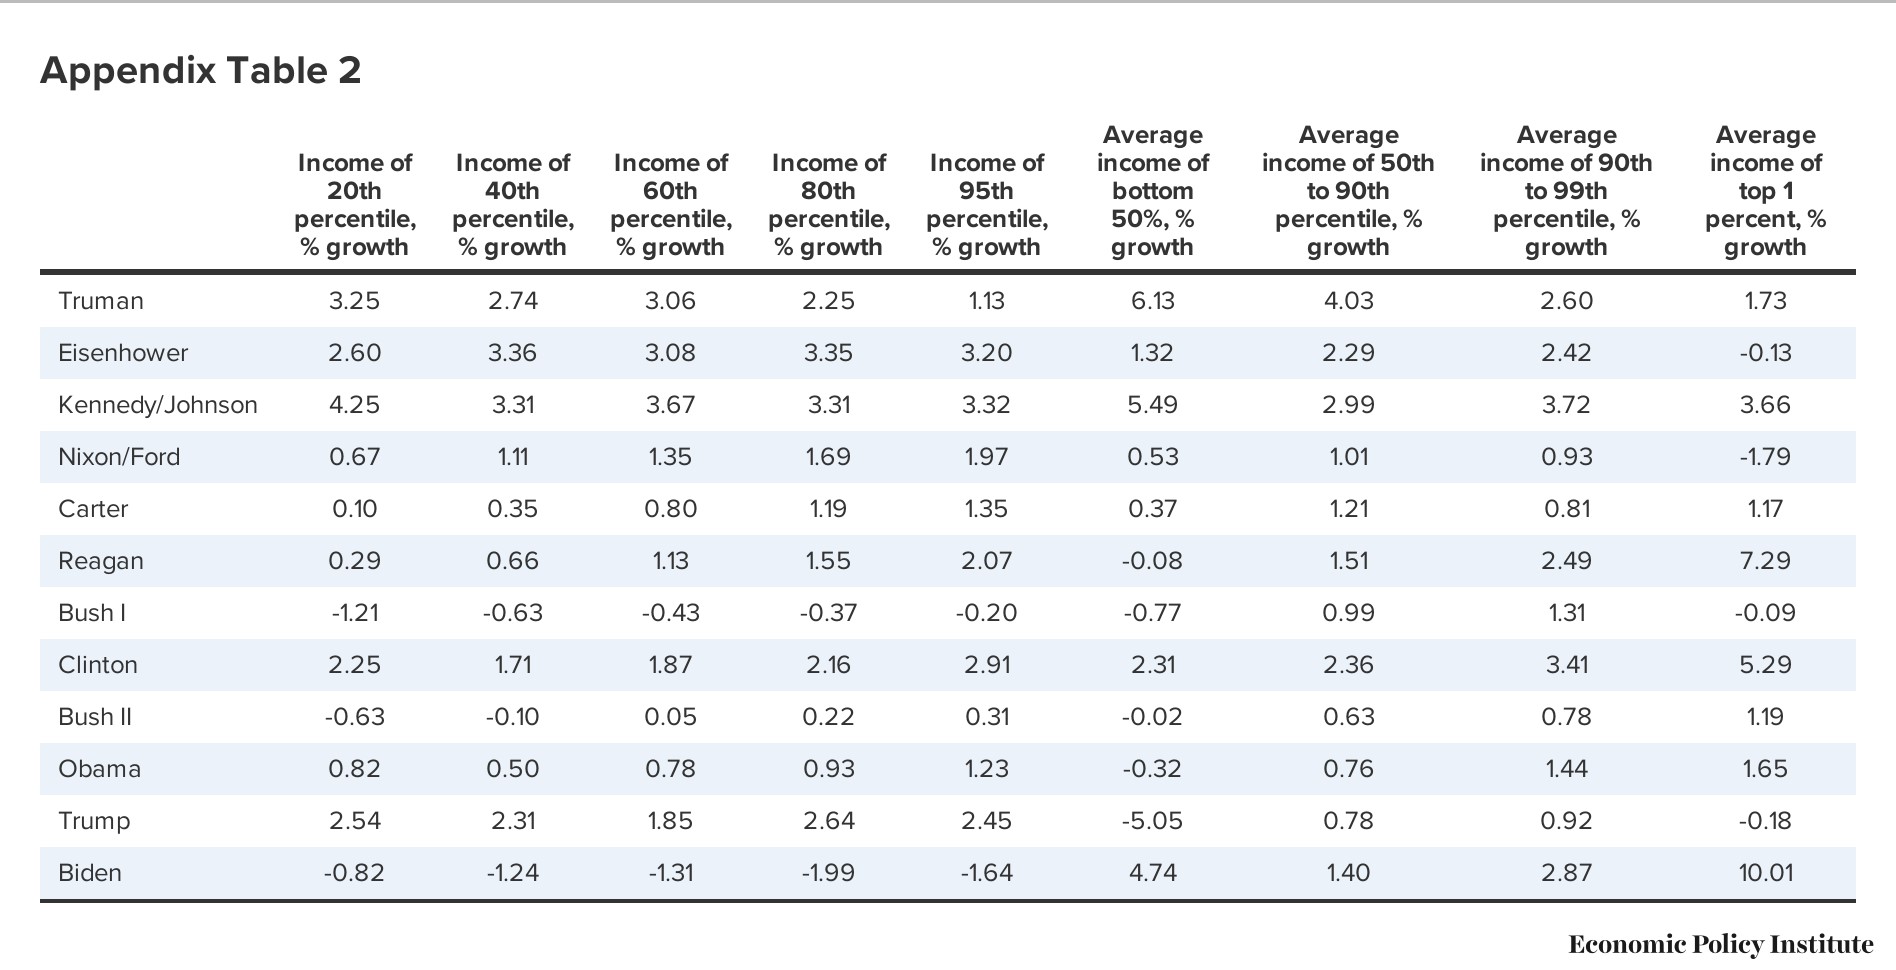
Appendix Tables 1 & 2 (below) are measures of aggregate economic performance. All data is collected at a quarterly frequency. We date the start of a presidential administration as the third quarter of the year following their election.
For growth measures in Appendix Table 1 (including inflation), we average the growth rates measured each quarter relative to the same quarter a year ago. And for Level variables (like the unemployment and federal funds rate), we use quarterly averages of the unemployment rate.
And for our comparisons by partisan control of the White House, we simply collapse the averages of all our variables by either Democratic or Republican control of the White House.
For the distributional variables in Appendix Table 2, we measure the start of a presidential administration as the year that they are inaugurated. For example, the Biden administration starts in 2021. So, the first growth rate measured under the Biden administration is average income in 2021 relative to average income in 2020. For making partisan comparisons, we again simply collapse the average growth rate of all variables by either Democratic or Republican control of the White House.
If you wish more detail on each graph, you can find a complete report here: “Economic performance is stronger when Democrats hold the White House.” Economic Policy Institute.