– by New Deal democrat The Bonddad Blog The bifurcation of the new vs. existing home markets continued in March, per the report on existing home sales and prices yesterday. Remember that, unlike existing homeowners, house builders can vary square footage, amenities, lot sizes, and offer price and/or mortgage incentives to counteract the effect of interest rate hikes.On a seasonally adjusted basis, existing home sales declined from 438,000 to 419,000 in March. But this is well within the seasonally adjusted range of the past 16 months (gray, right scale in the graph below){also, note I am using Trading Economics graphs due to restrictions put on FRED by the Realtors; also note difference in scales): At their worst seasonally adjusted
Topics:
NewDealdemocrat considers the following as important: Hot Topics, housing, US EConomics
This could be interesting, too:
NewDealdemocrat writes JOLTS revisions from Yesterday’s Report
Joel Eissenberg writes No Invading Allies Act
Bill Haskell writes The North American Automobile Industry Waits for Trump and the Gov. to Act
Bill Haskell writes Families Struggle Paying for Child Care While Working
– by New Deal democrat
The bifurcation of the new vs. existing home markets continued in March, per the report on existing home sales and prices yesterday. Remember that, unlike existing homeowners, house builders can vary square footage, amenities, lot sizes, and offer price and/or mortgage incentives to counteract the effect of interest rate hikes.
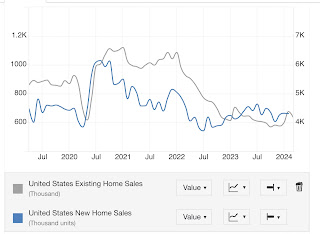
On a seasonally adjusted basis, existing home sales declined from 438,000 to 419,000 in March. But this is well within the seasonally adjusted range of the past 16 months (gray, right scale in the graph below){also, note I am using Trading Economics graphs due to restrictions put on FRED by the Realtors; also note difference in scales):
At their worst seasonally adjusted levels last year, existing home sales were down over 40% from their 2021 peak. Meanwhile new home sales (blue, left scale), at their low in July 2022 down almost 50% from their 2021 peak, responded to mortgage rates by rebounding during much of last year before fading again in the past few months. They are presently down 35% from peak.
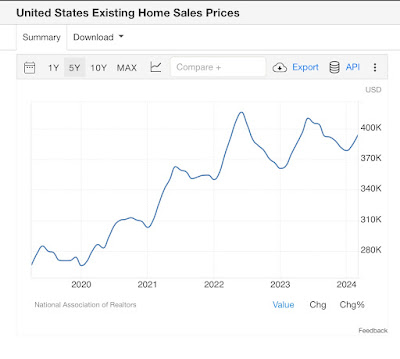
Some of the difference in trajectories between new and existing home sales can be explained by prices. Because so many homeowners have been frozen in place by their existing 3% mortgages, the inventory of existing homes for sale remains low, and that has driven prices higher almost consistently since the onset of the pandemic:
Although I can’t show you a graph, similar to the trajectory of the FHFA and Case Shiller repeat sales indexes, the median price for existing homes briefly turned negative in early 2023, troughing at -3.0% YoY in May. Thereafter YoY comparisons increased to a peak of higher by 5.7% in February. In March median prices were higher by 4.8%, which may or may not just be a pause.
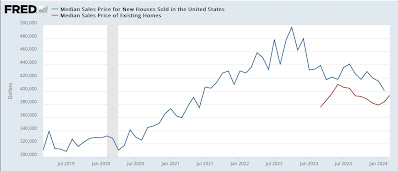
Meanwhile the median price for new houses was down by -7.6% YoY in February. The below graph shows actual median prices for the last 5 years of new homes vs. the last 12 months (all that Realtor.com allows FRED to publish) of existing homes:
Median existing home prices are currently about 40% higher than their immediate pre-pandemic level, while new home prices are about 30% higher.
Ultimately both the new and existing home markets are driven by mortgage rates. With a diminished supply of existing homes (because of prospective sellers being frozen in place by their current mortgage rates), their relative scarcity has driven prices comparatively higher than for new homes, especially as builders have moved aggressively to bring the purchase price of new homes down. This bifurcation will continue until the Fed moves significantly on rates.


