– by New Deal democrat The Bonddad Blog As per my usual caveat, while new home sales are the most leading of the housing construction metrics, they are noisy and heavily revised. That was true again this month, as sales (blue in the graph below) increased almost 9% m/m to 693,000 annualized, after February was revised downward by -25,000 to 637,000. As the five year graph below shows, after the initial Boom powered by 3% mortgage rates, sales declined almost 50% in 2022, but have stabilized in the 650,000 +/-50,000 range for the past 16 months. For comparison I also include the much less noisy, but slightly less leading single family housing permits (red), which as anticipated appear to have started to follow sales down from their peak:
Topics:
NewDealdemocrat considers the following as important: Hot Topics, politics, US EConomics
This could be interesting, too:
Robert Skidelsky writes Lord Skidelsky to ask His Majesty’s Government what is their policy with regard to the Ukraine war following the new policy of the government of the United States of America.
NewDealdemocrat writes JOLTS revisions from Yesterday’s Report
Joel Eissenberg writes No Invading Allies Act
Ken Melvin writes A Developed Taste
– by New Deal democrat
As per my usual caveat, while new home sales are the most leading of the housing construction metrics, they are noisy and heavily revised.
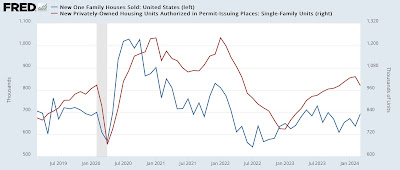
That was true again this month, as sales (blue in the graph below) increased almost 9% m/m to 693,000 annualized, after February was revised downward by -25,000 to 637,000. As the five year graph below shows, after the initial Boom powered by 3% mortgage rates, sales declined almost 50% in 2022, but have stabilized in the 650,000 +/-50,000 range for the past 16 months. For comparison I also include the much less noisy, but slightly less leading single family housing permits (red), which as anticipated appear to have started to follow sales down from their peak:
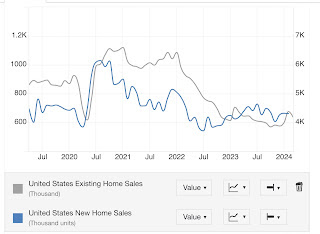
Here is a re-run of the graph I posted last week, showing the differing trajectories of new vs. existing home sales, showing that existing home prices remained elevated longer, and have taken longer to decline, by 40% vs. 50%:
Because mortgage rates have risen somewhat in the past few months (from 6.67% to 7.10%, I expect this range in new home sales to continue, with a slight downward bias in the immediate months ahead.
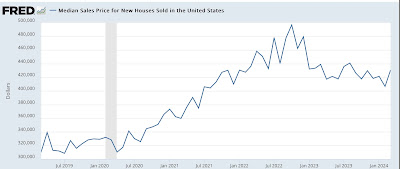
Also unlike existing home sales, where inventory is being constrained by would-be sellers trapped in 3% mortgages and thus prices remain near all-time highs, the median price of new homes declined as much as -16% from peak at their lows last year, and are still down -13.3%:
But, like sales, on a YoY basis prices have stabilized, and are only down -1.9%.
As I almost always point out, sales lead prices. Thus as shown above the range-bound sales for the last 16 months are leading to more stable prices.
The bottom line is that I expect this range-bound behavior in sales and prices, as well as the bifurcation between the new and existing home markets to continue until such time as the Fed moves significantly on interest rates.
As mortgage rates remain rangebound, so do new home sales, Angry Bear by New Deal democrat.


