– by New Deal democrat The Bonddad Blog On Friday the CDC updated its COVID death statistics through March 31, which means that we now have 4 full years of data. It also updated its hospitalization data through April 20, and to cut to the chase, last week saw a record low hospitalizations for COVID – 5,615 – since its onset. So this is a good time to look at the state of the now-endemic pandemic. When it comes to both hospitalization and death statistics, the first two years and the last two years look entirely different by scale. Let’s start with hospitalizations. Here are the first two years: The worst hospitalizations ever were just over 150,000 in the week of January 15, 2022 during the original Omicron BA.1 wave. The lowest
Topics:
NewDealdemocrat considers the following as important: 2024, covid, Healthcare, history
This could be interesting, too:
Ken Melvin writes A Developed Taste
Bill Haskell writes Families Struggle Paying for Child Care While Working
Joel Eissenberg writes RFK Jr. blames the victims
NewDealdemocrat writes Constitutional Interregnum
– by New Deal democrat
On Friday the CDC updated its COVID death statistics through March 31, which means that we now have 4 full years of data. It also updated its hospitalization data through April 20, and to cut to the chase, last week saw a record low hospitalizations for COVID – 5,615 – since its onset. So this is a good time to look at the state of the now-endemic pandemic.
When it comes to both hospitalization and death statistics, the first two years and the last two years look entirely different by scale.
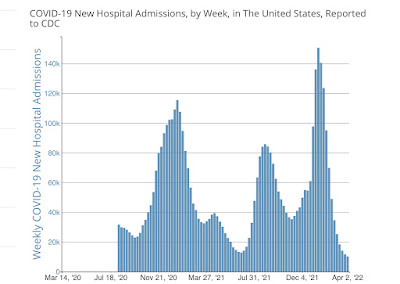
Let’s start with hospitalizations. Here are the first two years:
The worst hospitalizations ever were just over 150,000 in the week of January 15, 2022 during the original Omicron BA.1 wave. The lowest week until the end of the first two years was 12,821 during June 2021. At the very end, in the week of April 2, 2022, a new all-time low of just over 10,000 was set.
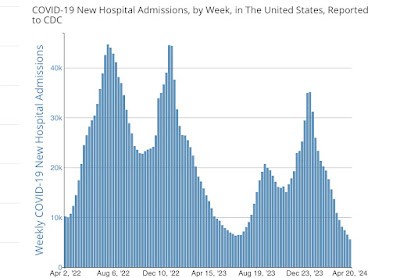
Now let’s look at the last two years:
Note the complete difference in scale. The same week of April 2, 2022 is nowhere near the lowest number, which as I wrote at the outset, was set last week at 5,615. The worst week was just under 45,000 in July 2022.
And it isn’t just the extremes that were lower. Below is the 52 week cumulative average of hospitalizations for the last 3 years (since the CDC didn’t start reporting this data until August 2020, I’ve excluded the first year:
4/1/21-3/31/22 2.660 million
4/1/22-3/31/23 1.150 million
4/1/23-3/31/24 0.855 million
The trend of declining hospitalizations YoY has been continuing throughout the past year. Here are some of those numbers:
10/1/22-9/30/23 1.020 million
1/1/23-12/31/23 0.910 million
2/1/23-1/31/24 0.880 million
3/1/23-2/29/24 0.850 million
This is a story of almost relentless decline.
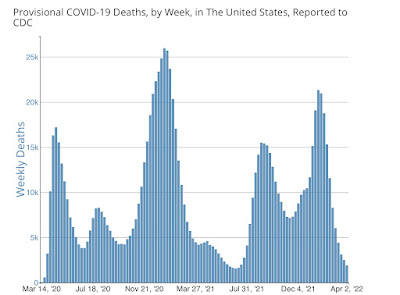
And it’s the same story with the data on deaths. Here are the first two years:
There were almost 26,000 deaths in the first week of January 2021 alone, the worst week of the entire pandemic. The lowest number were 1,543 in the first week of July 2021 (when we all hoped that mass immunization might work to end the pandemic). During the week ending April 2, 2022, there were still just over 1,900 deaths.
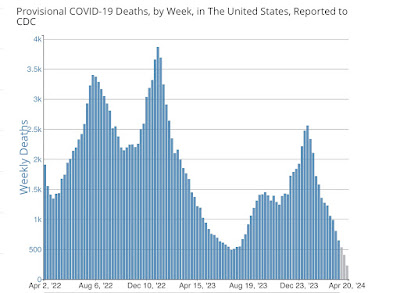
Now here are the last two years. Once again, notice the complete difference in scale:
April 2 of 2022 was a comparatively high week. The highest number of deaths were 3,869 during the week of January 7, 2023. The lowest were 491 during the week of July 7, 2023. As of March 30 of this year (the last week of complete data), there were 648. As I’ll describe further below, we will probably set a new all-time record low for deaths as well once all of April’s data is in.
The same pattern of ever fewer deaths YoY appears as we saw for hospitalizations:
4/1/20-3/31/21 504,000
4/1/21-3/31/22 433,000
4/1/22-3/31/23 128,000
4/1/23-3/31/24 64,000
Once again, the deceleration has been ongoing in the past year. Here are YoY cumulative deaths for some of the last 6 months:
10/1/22-9/30/23 83,000
1/1/23-12/31/23 75,000
2/1/23-1/31/24 70,000
3/1/23-2/29/24 67,000
Because COVID expresses seasonality, with worse waves during the cold weather and generally lower numbers during warm weather, below I’ve divided deaths into two 6 month periods.
Here’s the cold weather period:
10/1/20-3/31/21 353,000
10/1/21-3/31/22 267,000
10/1/22-3/31/23 66,000
10/1/23-3/31/24 40,000
And here’s the warm weather period:
4/1/20-9/30/20 211,000
4/1/21-9/30/21 166,000
4/1/22-9/30/22 62,000
4/1/23-9/30/23 23,000
As you can see, in each year there are more deaths during cold than during warm weather. And the pattern of YoY improvement is apparent for each period.
This is all good news.
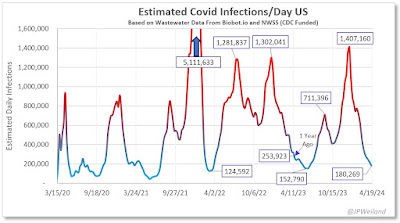
So where do we go in the near term? The trends continue to be positive. Recall that wastewater counts lead hospitalizations by several weeks, which in turn lead deaths by several weeks.
So here is the latest wastewater count from the CDC:
Wastewater particles are down 87% since their Holiday season peak, and continued to decline last week. This means that both hospitalizations – as of last week down 84% from their Holiday peak – and deaths – as of March 30 down 75% from their post-Holiday peak – should both continue to decline.
And if deaths decline to a number 87% below their post-Holliday peak, that would mean only 333 deaths in a few weeks.
Finally, how does this compare with the flu? Well, the typical flue season gives rise to about 35,000 deaths +/-10,000. So even at 64,000 COVID is presently the equivalent of a very bad flu season. If the trends of the past several years continue, then in 1 or 2 years we will be down in the vicinity of 35,000 deaths per year.
I am cautiously hopeful that is where we are headed. Because every single variant in the past 2+ years has been a descendant of the original Omicron BA.1 strain – including BA.2, BA.2.12.1, BA.4, BA,5, XBB, JN.1, and the newest variants, KP.1&2. So long as that remains the case, I will remain optimistic.
Final COVID-19 update for 2023: mainly good news (at least on a comparative basis), Angry Bear, by New Deal democrat.

