– by New Deal democrat This week’s data focuses on house prices and new home sales, and the more important personal income and spending report on Friday. In the housing data I am looking at any movement towards rebalancing between new and existing home sales. To recapitulate, the big increase in mortgage rates has locked up the existing home market, increasing the share of new houses as to total sales. With existing homes, we saw inventory increasing. In the repeat sales index, I am looking for signs that price increases might be abating. This morning both the FHFA and Case Shiller repeat home sales indexes were released through April. Three months ago I wrote that “for the next seven months the comparisons will be against an average 0.7%
Topics:
NewDealdemocrat considers the following as important: FHFA and Case Shiller Housing, Hot Topics, US EConomics
This could be interesting, too:
NewDealdemocrat writes JOLTS revisions from Yesterday’s Report
Joel Eissenberg writes No Invading Allies Act
Bill Haskell writes The North American Automobile Industry Waits for Trump and the Gov. to Act
Bill Haskell writes Families Struggle Paying for Child Care While Working
– by New Deal democrat
This week’s data focuses on house prices and new home sales, and the more important personal income and spending report on Friday.
In the housing data I am looking at any movement towards rebalancing between new and existing home sales. To recapitulate, the big increase in mortgage rates has locked up the existing home market, increasing the share of new houses as to total sales. With existing homes, we saw inventory increasing. In the repeat sales index, I am looking for signs that price increases might be abating.
This morning both the FHFA and Case Shiller repeat home sales indexes were released through April. Three months ago I wrote that “for the next seven months the comparisons will be against an average 0.7% increase per month in 2023. Because house price indexes have shown a demonstrated lead over shelter costs as measured in the CPI, if present trends continue, as these YoY comparisons drop out, the YoY deceleration in OER in the CPI index should continue towards its more typical rate of between 2.5% to 4% YoY in the ten years before the pandemic.” Two months ago,
I reiterated that “I continue to believe that CPI for shelter will continue to decelerate on a YoY basis, but more slowly than before.”
Then last month I concluded, “there has been no significant YoY acceleration in the FHFA repeat sales index for the past six months, and appreciation in the Case Shiller Index has likely halted, with a lag, as well…. I expect the YoY comparisons to show renewed deceleration, which will ultimately – with a decided lag – show up in the shelter component of CPI as well.”
And that’s what has happened.
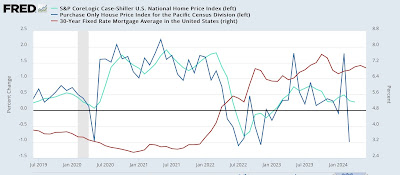
To start with, Keeping in mind that mortgage rates lead sales, which in turn lead prices, here’s what the monthly average in mortgage rates (red, right scale) look like compared with the monthly % change in house prices for the past five years:
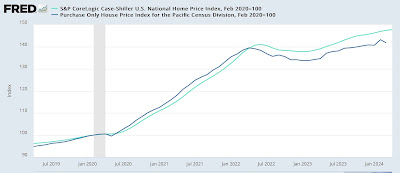
The relatively big decrease in mortgage rates between last November and this January led to a big increase in sales with an increase in prices as well. As mortgage rates have generally increased since then, sales have declined somewhat, and prices have started to follow suit. In this morning’s report, prices increased a seasonally adjusted 0.3% in the Case Shiller index, and 0.2% in the FHFA Index. Here’s what each index looks like normed to 100 as of just before the pandemic:
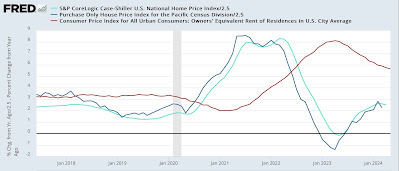
I’ll dispense with the long term graph this time, but instead here is the last seven years of the YoY% changes in the FHFA and Case Shiller national indexes (/2.5 for scale) compared with the CPI for owners’ equivalent rent which continues to show that the YoY gains in house prices are actually not out of line compared with prior to the pandemic:
On a YoY basis, the Case Shiller index is up 6.3%, down from its February peak of 6.6%. The FHFA Index is also up 6.3% YoY, down from its February peak of 7.2%. In other words, as anticipated the YoY increase in house prices has peaked, as monthly comparisons continue to be slightly below the equivalent gain 12 months previously, just as I first wrote would happen three months ago.
More importantly, in the next few months this trend should continue. The latest mortgage and price data continue to indicate that the shelter CPI for “owners’ equivalent rent” should continue to “aim” for a landing at 3.0-3.5% in roughly 12 months, or a deceleration on average of about 0.2% YoY per month.
The Bonddad Blog
Manufacturing treads water in April, while real construction spending turned down in March (UPDATE: and heavy truck sales weren’t so great either), Angry Bear, by New Deal democrat


