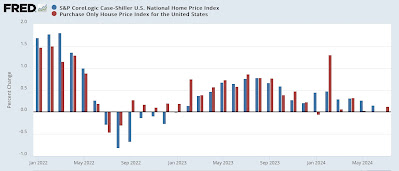
– by New Deal democrat This morning’s repeat house price indexes from the FHFA and Case Shiller continued to show deceleration in this metric which is very important to home buyers. Specifically, in the three month average through July, U.S. house prices rose 0.2% according to Case Shiller’s national index, and only 0.1% according to the slightly more leading Federal Housing Finance Agency (FHFA) purchase only index, both on a seasonally adjusted basis. For the last three months, the FHFA index has risen a *total* of 0.1% as well. The Case Shiller monthly change is also tied for the lowest in the past 18 months [Note: FRED has not updated the monthly Case Shiller numbers yet. When they do, I’ll update this graph]: On a YoY basis, the FHFA
Topics:
NewDealdemocrat considers the following as important: Repeat home sale prices, US EConomics
This could be interesting, too:
NewDealdemocrat writes JOLTS revisions from Yesterday’s Report
Bill Haskell writes The North American Automobile Industry Waits for Trump and the Gov. to Act
Bill Haskell writes Families Struggle Paying for Child Care While Working
Joel Eissenberg writes Time for Senate Dems to stand up against Trump/Musk
– by New Deal democrat
This morning’s repeat house price indexes from the FHFA and Case Shiller continued to show deceleration in this metric which is very important to home buyers. Specifically, in the three month average through July, U.S. house prices rose 0.2% according to Case Shiller’s national index, and only 0.1% according to the slightly more leading Federal Housing Finance Agency (FHFA) purchase only index, both on a seasonally adjusted basis. For the last three months, the FHFA index has risen a *total* of 0.1% as well. The Case Shiller monthly change is also tied for the lowest in the past 18 months [Note: FRED has not updated the monthly Case Shiller numbers yet. When they do, I’ll update this graph]:
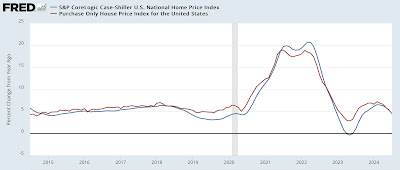
On a YoY basis, the FHFA Index rose 4.5%, while the Case Shiller measure rose 5.0%. These both compare with 5.4% YoY increases through June. The former also compares with 7.2% in February, and 19.8% in March 2022, and the latter with 6.6% in February, and 20.8% (!) in March 2022:
For the last six months, the FHFA index is only up 0.6%, for a 1.2% annual rate, while the Case Shiller index is up 1.2%, for an annual rate of 2.4%. As shown in the above graph, the latter rate would be absolutely typical for an annual increase before the pandemic, while the former would be significantly below the average outside of the 2006-10 housing bust.
This is of heightened importance compared with normal historical times, because of the outsized impact house prices, via OER, had on consumer inflation, and also because more recently my focus has been looking for movement towards rebalancing new and existing home sales. This morning’s report is evidence of that rebalancing.
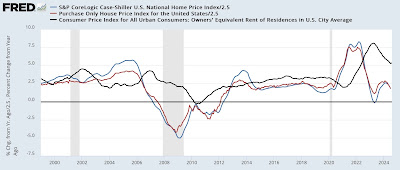
Finally, because the house price indexes lead the shelter component of the CPI (Owners Equivalent Rent, black in the graph below) by 12-18 months, this also means we can continue to expect deceleration in that very important component of consumer prices as well, if somewhat slowly:
Specifically Owners Equivalent Rent, which is 25% of the entire CPI, should continue to trend towards 3% YoY increases in the months ahead, continuing to bode well for both the headline and core measures of that index, and a tailwind for the Fed’s desire to lower interest rates.
The Bonddad Blog
Repeat home sale indexes show continued deceleration in house price inflation, Angry Bear, by New Deal democrat


